3 Solving for the steady state
Now, we’re ready to explore the predictions of the model.
To be precise, the model has several variables - \(A, h, \delta, \gamma\) that we take as “exogenous” (determined outside the model). Given those variables, we want to be able to explore the predictions of the model for “endogenous” variables (determined inside the model)- \(y, c, k, i\). Roughly speaking, we’re asking ourselves two sets of questions 1. If we knew \(A,h, \delta, \gamma\) what level of \(y, c, k, i\) would we expect the economy to arrive at eventually? How are countries that have different values of the parameters different from each other in terms of endogenous variables? 2. If \(A,h,\delta, \gamma\) change, how would \(y,c,k,i\) change over time?
How do we approach these questions? Let’s take a step back. The assumptions the model made meant that we could summarize (mathematically) the economy (in per worker form) in four equations:
- \(y_t = f(A, k_t, h) = A k_t^\alpha h^{1-\alpha}\)
- \(k_t = k_{t-1} - \delta k_{t-1} + i_{t-1}\)
- \(i_t = \gamma y_t\)
- \(y_t = c_t + i_t\)
The first equation says that output depends on parameters \(A, h\), and the amount of capital per worker \(k_t\). Equations 3 and 4 say that once we know output, and given the parameter \(\gamma\) we also know the amount of investment and consumption (per worker) in the economy. So we need to know what capital per worker \(k_t\) is today, and then we can figure everything else out about the economy today.
Equation 2 says that capital today depends on capital yesterday, and investment yesterday. But we know investment yesterday depends on output yesterday (just think about equation 3, but for \(t-1\)), and output yesterday depends on capital per worker yesterday (think about equation 1, rolled back to \(t-1\)). To sum up knowing capital per worker in the previous period tells us capital per worker today. Knowing capital per worker today tells us everything else about output per worker today, investment per worker today, and consumption today.
3.1 Digging into how capital changes over time
Let’s look at how capital per worker evolves over time again:
\[k_t = k_{t-1} - \delta k_{t-1} + i_{t-1}\]
Another way of writing this is
\[ k_t - k_{t-1} = i_{t-1} - \delta k_{t-1} \]
That is, the change in the number of machines per worker is related to investment, the rate of depreciation, and the size of the capital stock in the previous period.
Exercise:. Explain (mathematically and intuitively) when the amount of capital per worker will be increasing, when it will be decreasing, and when it will be constant.
3.2 Steady state
It turns out that the assumptions we’ve made imply that the economy will eventually converge to a steady state where \(k_t = k_{t-1}\) and then nothing will change after that. As the previous exercise reveals, this is when \(i_{t-1} = \delta k_{t-1}\). Intuitively, this is when the amount of new capital being built is exactly enough to replace the capital that’s wearing out. It’s easiest to see how this happens graphically, by drawing the functions for \(\delta k\) and \(i\) on the same graph:
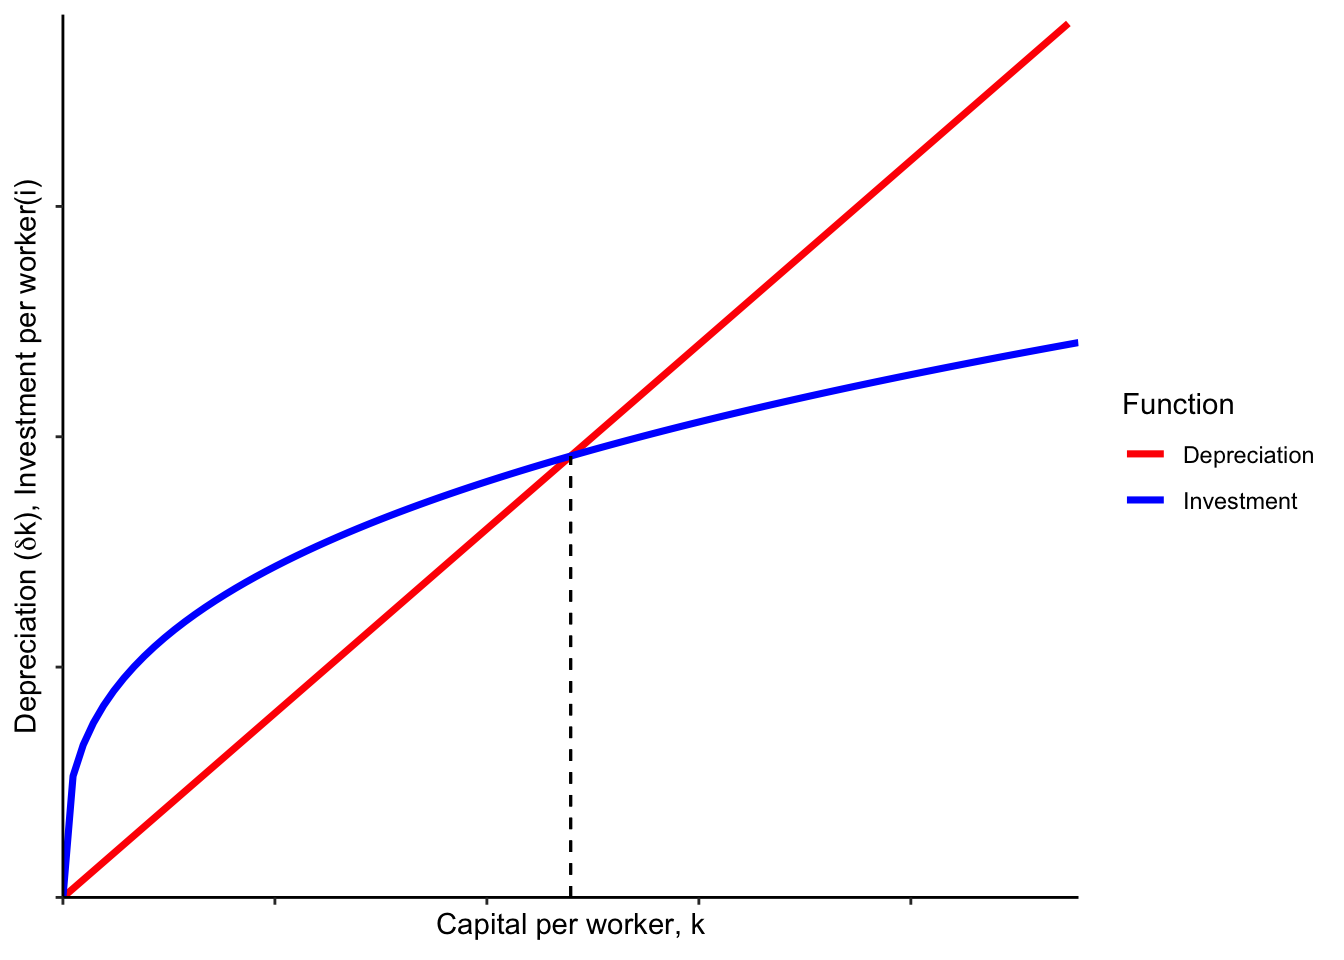
The intersection of the depreciation and investment functions is where they are equal (the dashed line indicates this level). At that point, capital per worker will not change over time.
Exercise:. Explain why we would end up at the level of capital per worker indicated by the dashed line if we started out at any other (positive) level of capital per worker.
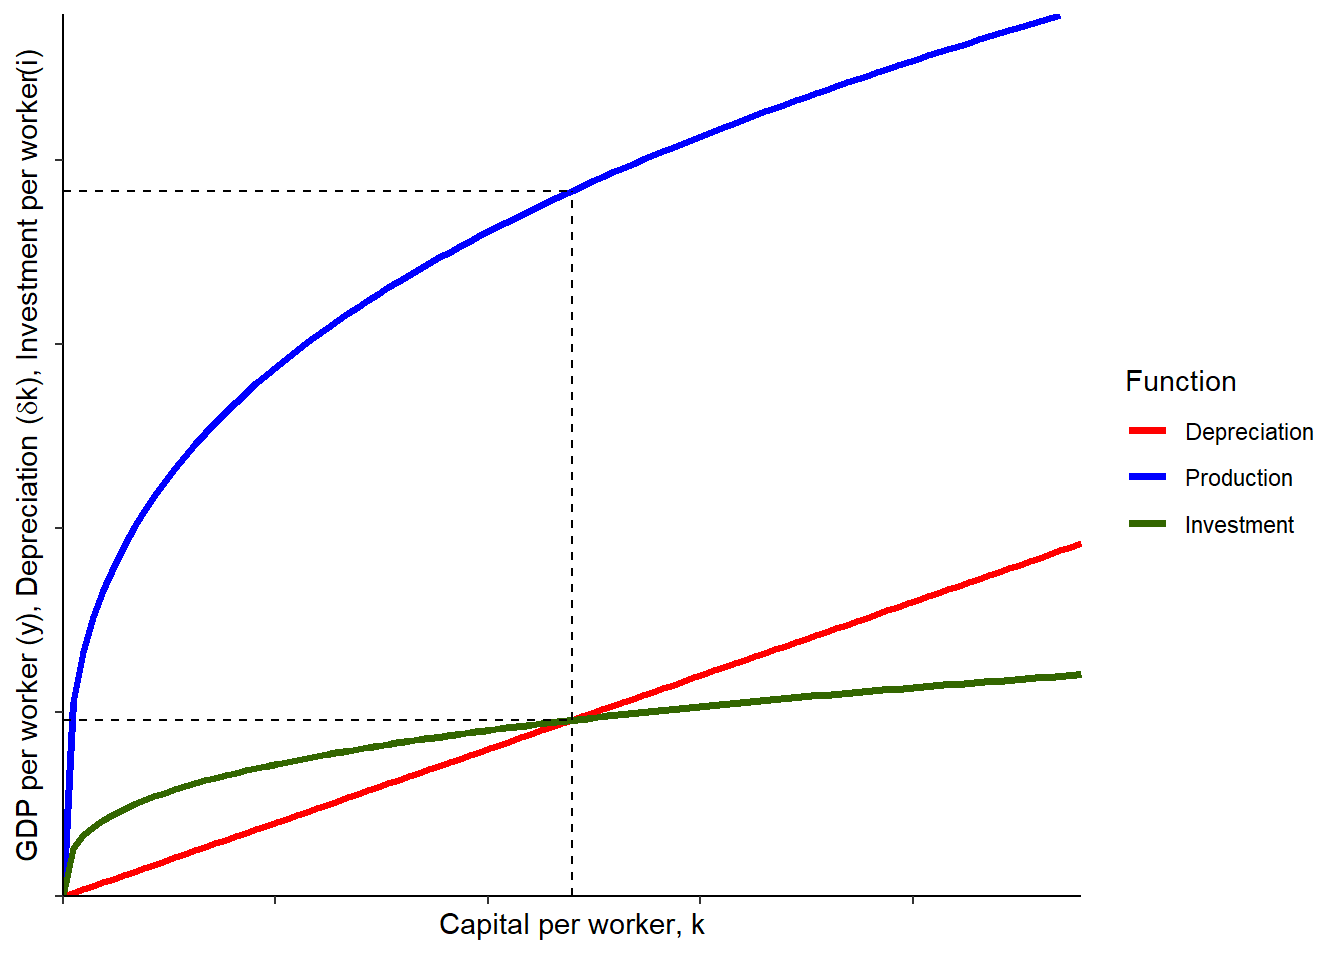
Notice that we can also add the production function to graphically see the level of GDP per worker in steady state as well.
3.2.1 Preview
Now that we know how to find a steady state, we can compare two countries that are identical in all ways except a single parameter. For instance, let’s imagine we are using the Solow model to predict how two countries that are identical in all ways except their savings rate (\(\gamma\)) will be different.
Exercise:. On a single graph, illustrate production, investment, and depreciation curves for two countries that have the same productivity, human capital per worker and depreication, but different savings rates. Clearly label the steady state levels of capital per worker and output per worker.
Which country has higher output per worker? Which country has higher consumption per worker?