1 Introduction: What facts do we want to explain?
Before we jump into the model, we should think about what economic outcomes the model is attempting to make predictions about.
We most often compare countries in ``per capita’’ (per person) terms. When economists talk about a countries’ level of “economic development” we usually mean their level of GDP per capita.
However, the Solow model really makes predictions in per-worker terms. Countries with more people usually have more workers (but obviously, this could depend on labor force participation and demography).
Economists who have examined this data have found a set of “stylized facts1” that are reasonably consistent across countries since around the early 19th century (around the time of the Industrial Revolution). A partial list of these facts we would hope a model of long-run growth is consistent with:
- There is a wide distribution of GDP/person or GDP/worker across countries.
- The countries that are richer than others are similar in several dimensions:
- They tend to have more physical capital per worker.
- They save and invest at a higher rate than other countries.
- Their workers tend to have a higher level of education and are healthier (they have more human capital).
- They seem better at transforming physical inputs into output than poorer countries (they are more productive).
- People who live in countries that are richer consume more on average.
There are some other facts - which are perhaps more subtle - that we might want to try to understand or be able to explain in light of the Solow model. Two of these are:
- Rich countries tend to grow at similar rates in the long run.
- Countries at a similar level of economic development often have similar geographic, institutional, and cultural characteristics, and also similar policies.
Economists have found these facts to be generally true for the post-Industrial-Revolution period using a variety of approaches and datasets. In the rest of this section, we’ll illustrate these facts using data from the Penn World Tables. This is the most commonly used dataset for examining long-run growth across countries.
1.1 Fact 1: Some countries are richer than others on a per-capita basis
There is an enormous degree of inequality across countries.2 In 2019, the richest country in the world (on a per capita basis) was Qatar, with a real GDP per capita more than 125 greater than that of the poorest in the world (the Central African Republic). Many of the very richest countries in the world are really more like extremely wealthy city-states (like Macau and Singapore) or have large amounts of oil resources (such as Qatar and or Norway), or are financial centers (Ireland, Switzerland).
|
|
Of course, looking at the extremes only tells us so much. Most countries fall somewhere in the middle, although the data has a heavy left tail (there are more very, very poor countries than there are very very rich ones). The histogram below illustrates the distribution. (Notice that the x axis has a log scale!)
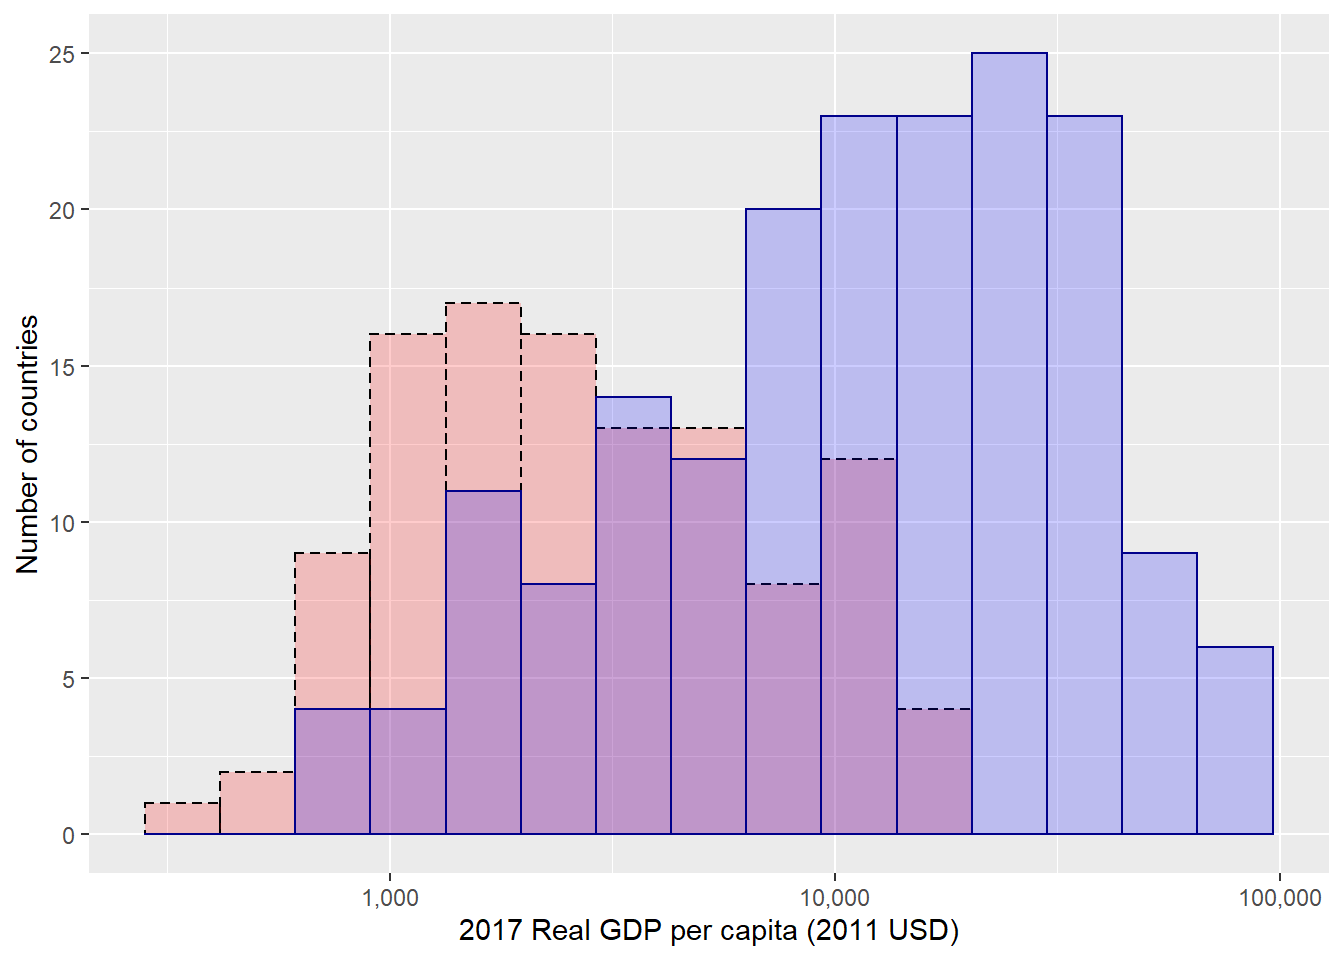
One thing that’s important to remember is that looking at the distribution of wealth in a given year doesn’t show how the distribution has changed over time. In particular, there has been an enormous amount of growth in GDP per capita over the past several decades in most countries. That can be seen by the change in distribution over time. This can be seen in the histogram below, which shows the same graph as above in blue, but with the distribution of real GDP per capita in 1960 (the dashed outline with red fill). Keeping in mind that this is real GDP, this means that (adjusting for prices), the quantity of output per person has grown dramatically over the past several decades almost everywhere.
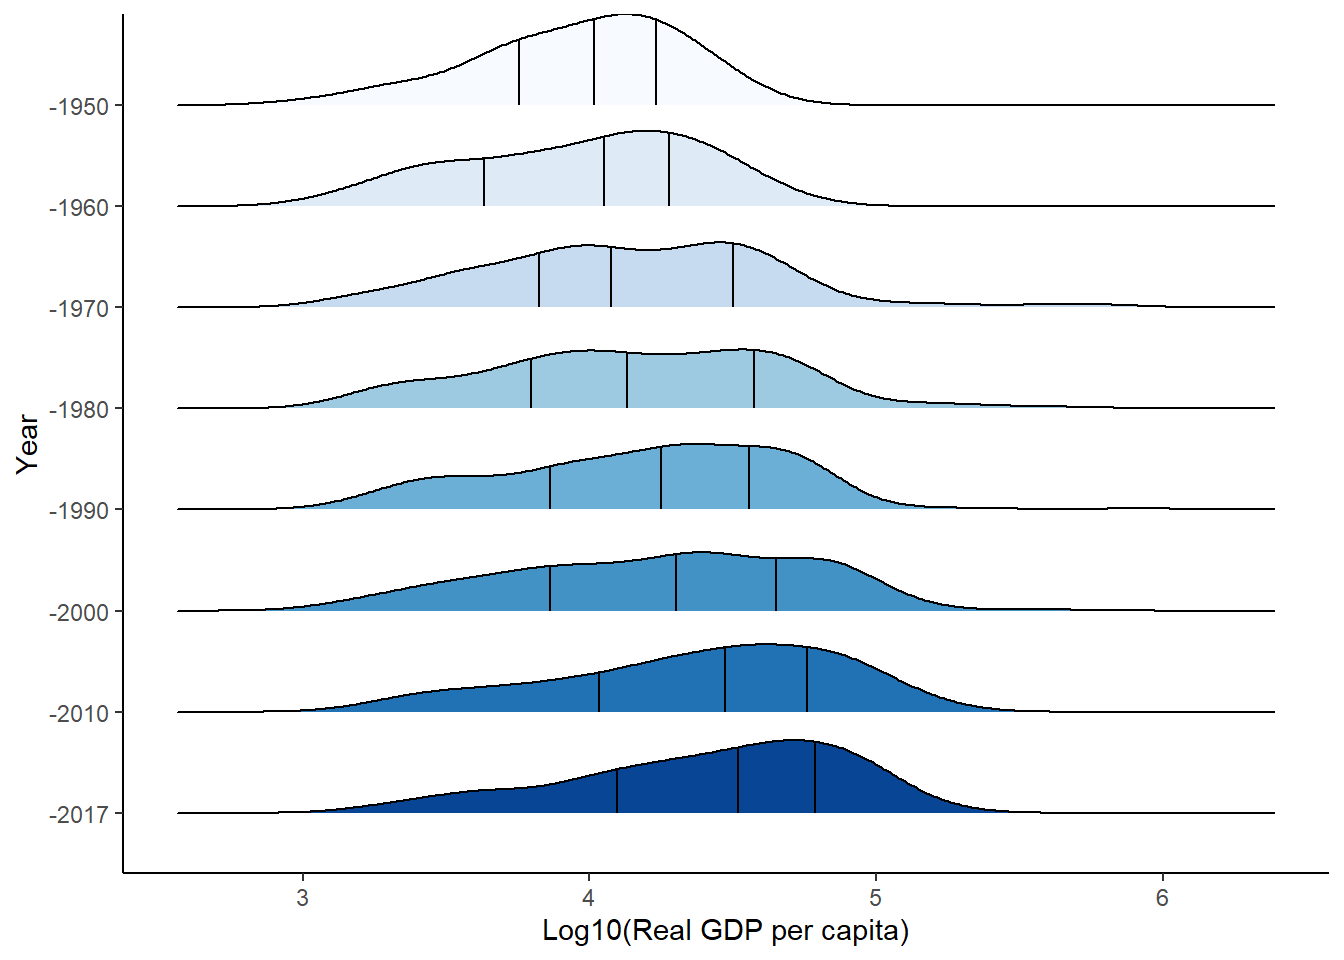
We can also track the evolution of the distribution over decades to get a sense of how it’s shifted over time. The distributions below show the distribution at the start of each decade since 1950, with 2019 at the end. The vertical lines indicate quantiles – to the left of the first line is the lowest 25% of the distribution, the middle line indicates the median, and to the right of the last line is the upper 25% of the distribution. The country at the 25th percentile of the distribution in 2019 has a GDP/worker (in real terms) that is a bit higher than the median country in 1950.
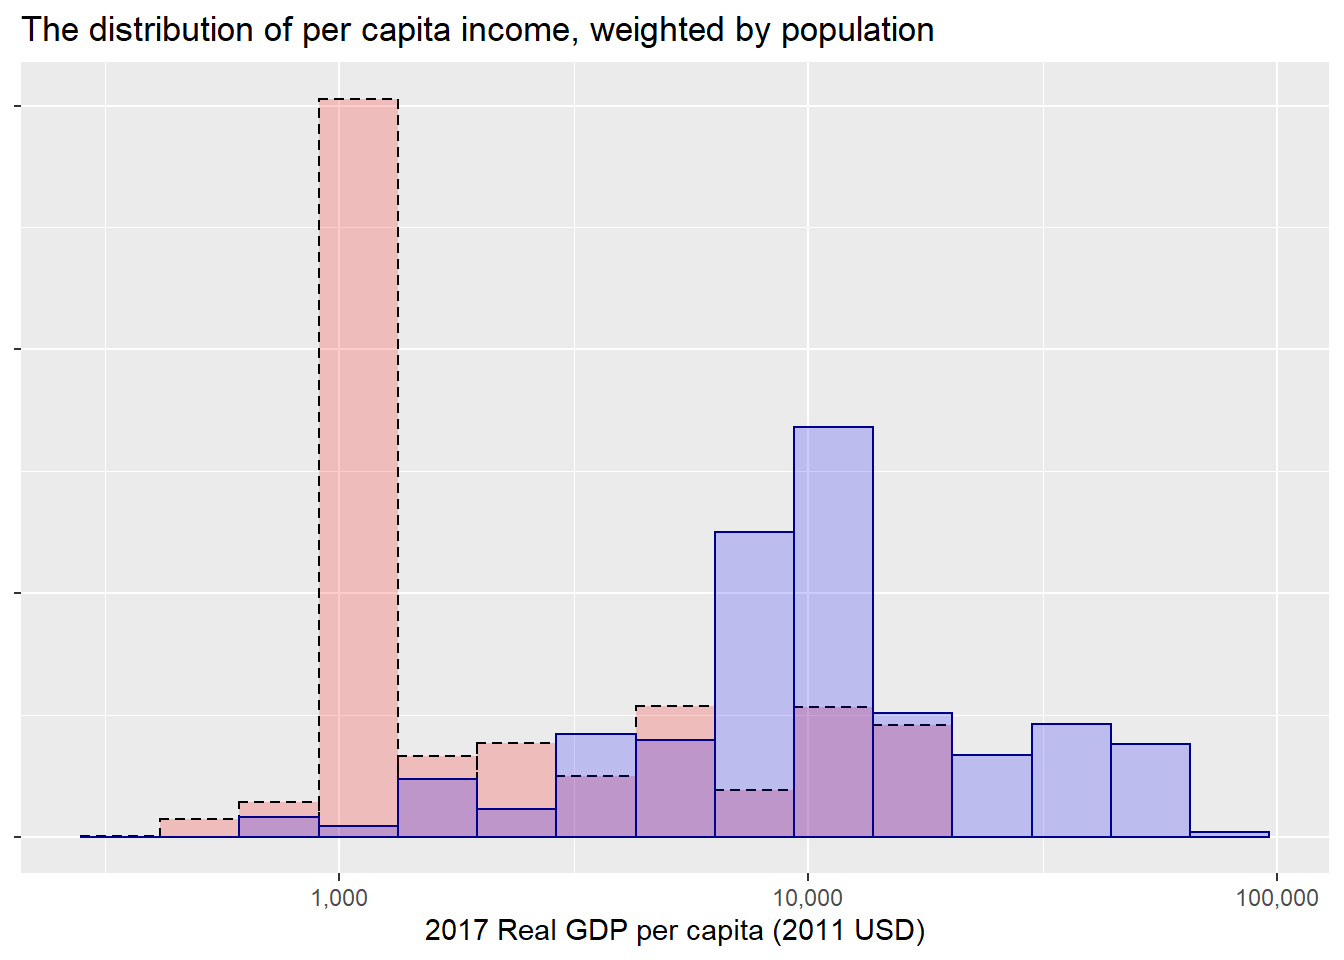
We can also think about the number of people living in countries at different levels of development. Many fewer people live in countries that are extremely poor on average. This can be seen in the next plot, where countries are weighted by their population. The punchline is that there’s been a shift since in 1960, where a huge mass of the world population lived in countries where real GDP per capita was roughly 1000, but now much of that has shifted to places where it’s closer to 10,000. (And very, very few people live in countries where the GDP per capita is close to 100,000 dollars).3

1.2 Fact 2. Countries that are richer (per capita) tend to have more physical capital per worker,save and invest at a higher rate, have a higher level of human capital, and are more productive
“Happy families are all alike; every unhappy family is unhappy in its own way.” - Tolstoy, Anna Karenina
Economists have noted that countries that have higher GDP per capita also tend to be similar along several dimensions. To an extent, this is unsurprising; if we think about real GDP as the amount of production occurring within a country in a given period of time, then those countries must either be using more of the factors of production or using the existing factors more effectively. Solow was focused on post-Industrial Revolution growth when investment in physical capital (think machinery, factories, and so on) was important, and it turns out those are still correlated with high levels of GDP per capita.
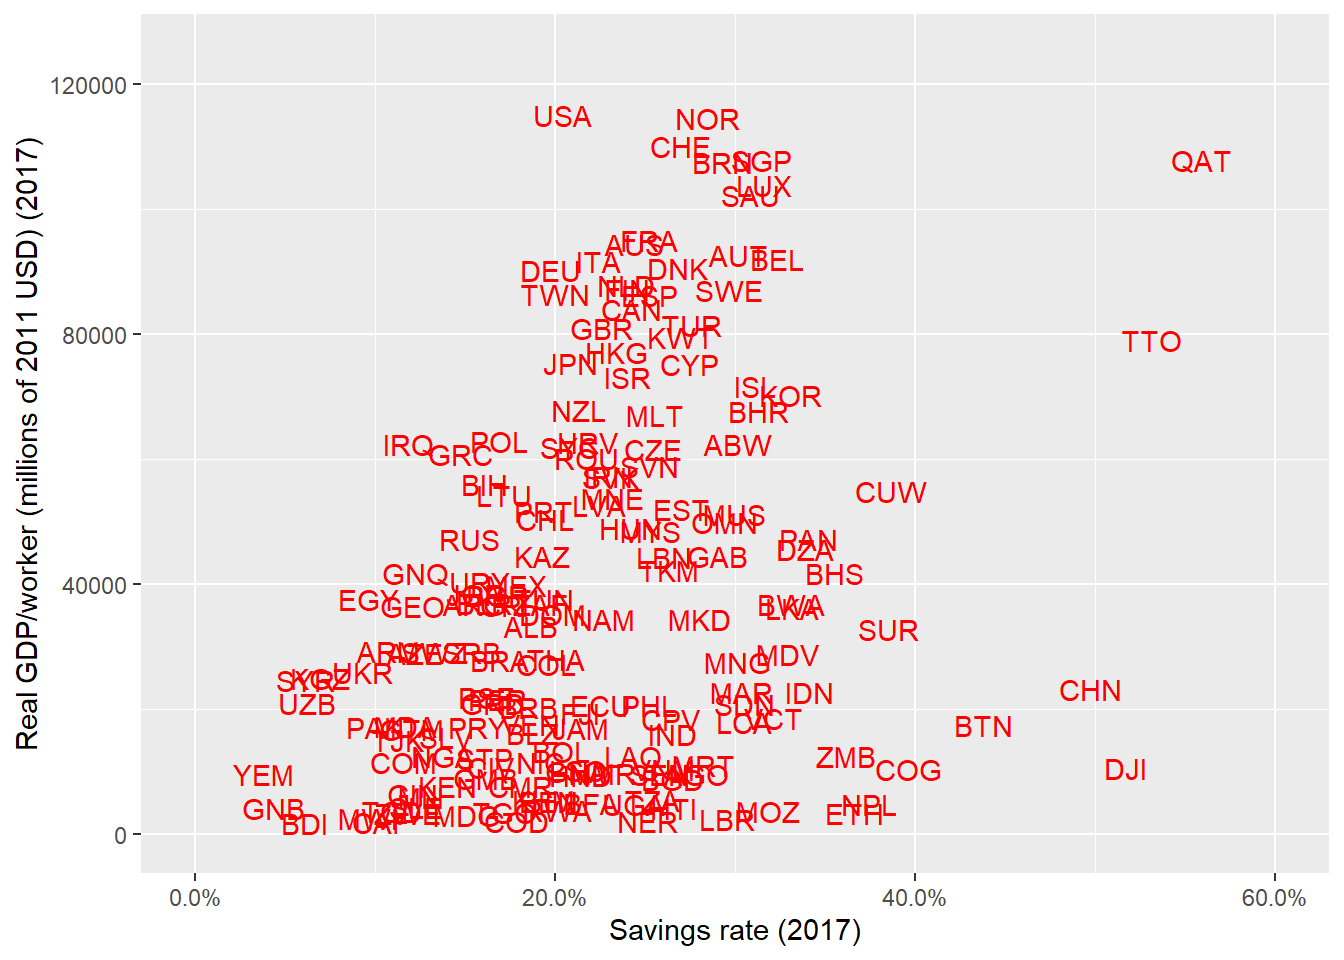
A key feature of physical capital is that it is itself produced, through investment. Investment is paid for by saving. Although not all investment is financed by domestic saving (and not all investment is investment in physical capital), the rate of saving (how much output that isn’t consumed) is also positively correlated with GDP per capita.
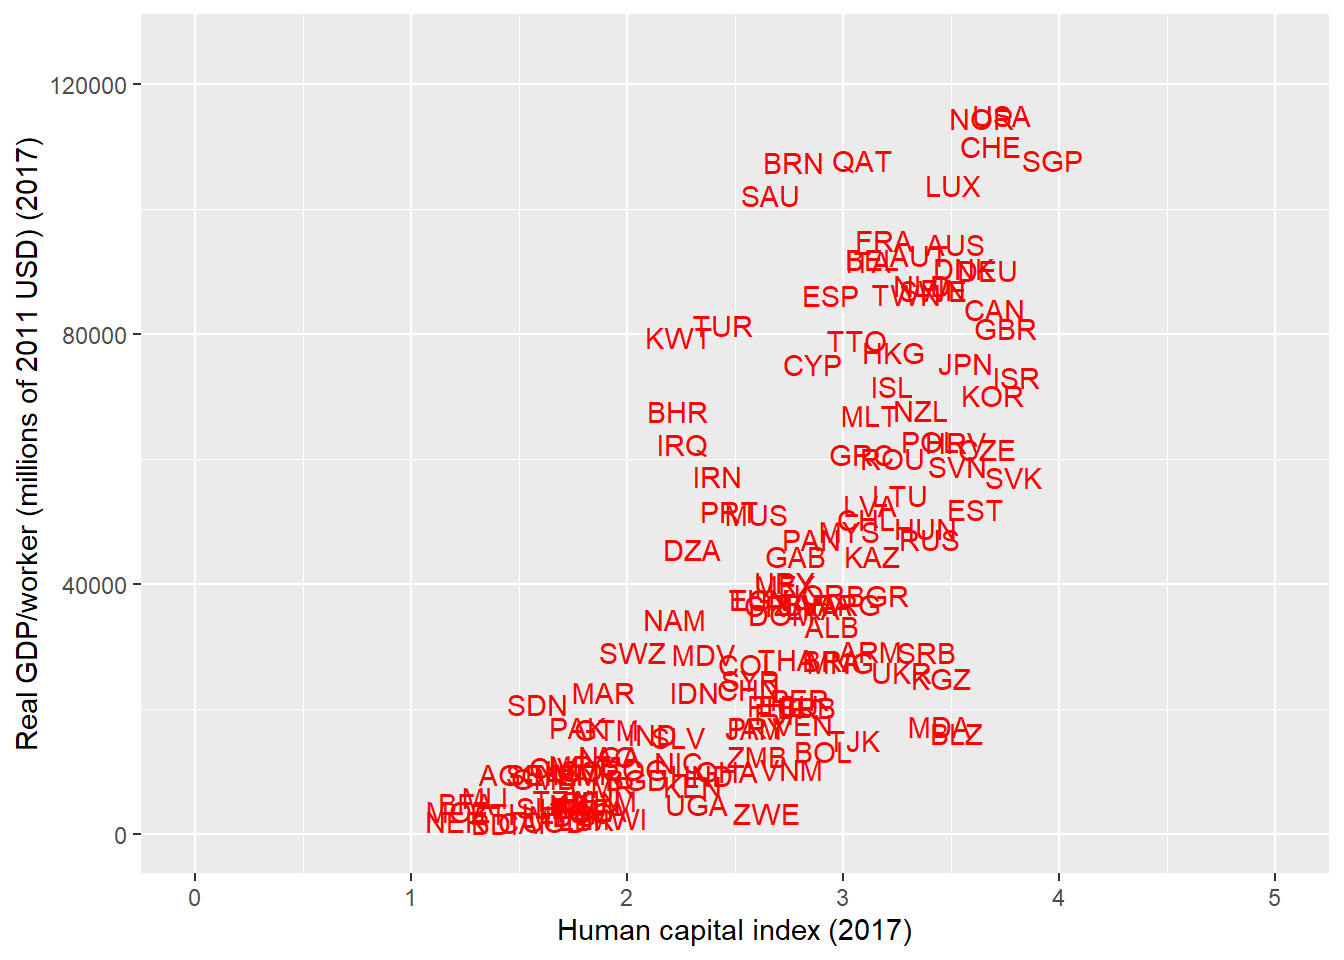
Human capital is the knowledge, skills workers acquire through education, training, and experience, as well as things like their health. The most obvious - although by no means most complete - way of measuring human capital is through measuring the education of workers (and how that education translates into the ability to produce things, as reflected by higher wages). The scatterplot below shows that countries that are richer tend to also have higher measured values of human capital.
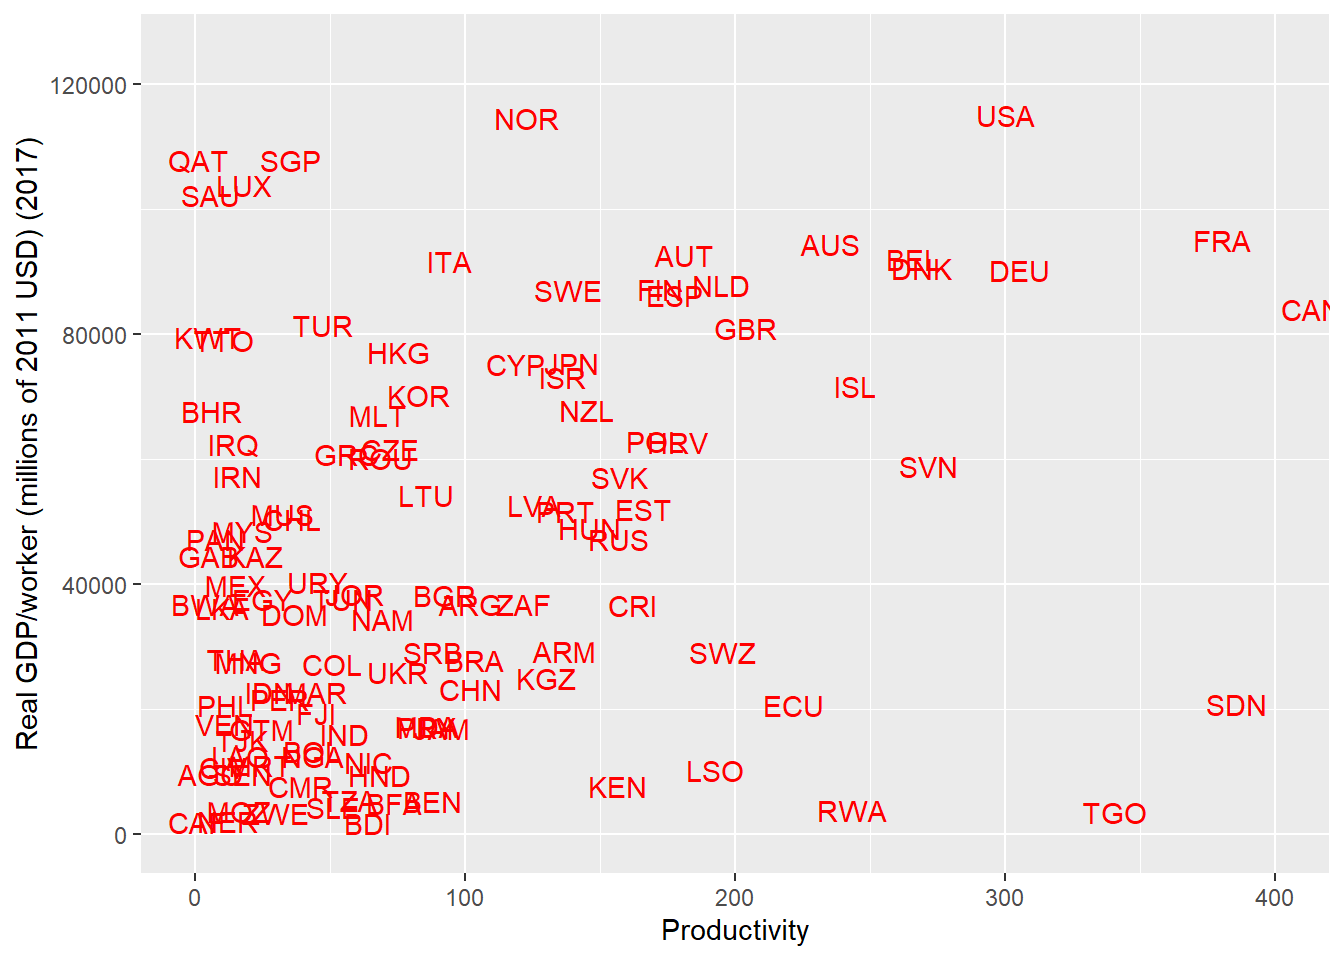
Even after we account for physical and human capital, workers in some countries generate more GDP (on average) than other workers; that is to say, they are more productive. Put another way workers in different countries appear to produce different amounts, even with the same measured amount of physical machinery to work with and education.
Some of this is due to differences in the available technology of production (broadly defined), or due to some degree of mis-measurement of inputs. But some of it is also probably due to workers using existing resources more efficiently.4
In short, countries that are richer (on a per capita or per worker basis) tend to be similar in a number of dimensions: they have more physical capital (financed through higher savings rates), higher levels of human capital, and are more productive. These will also be true in the Solow growth model.
1.3 Fact 3: People in richer countries consume more than people in poor countries
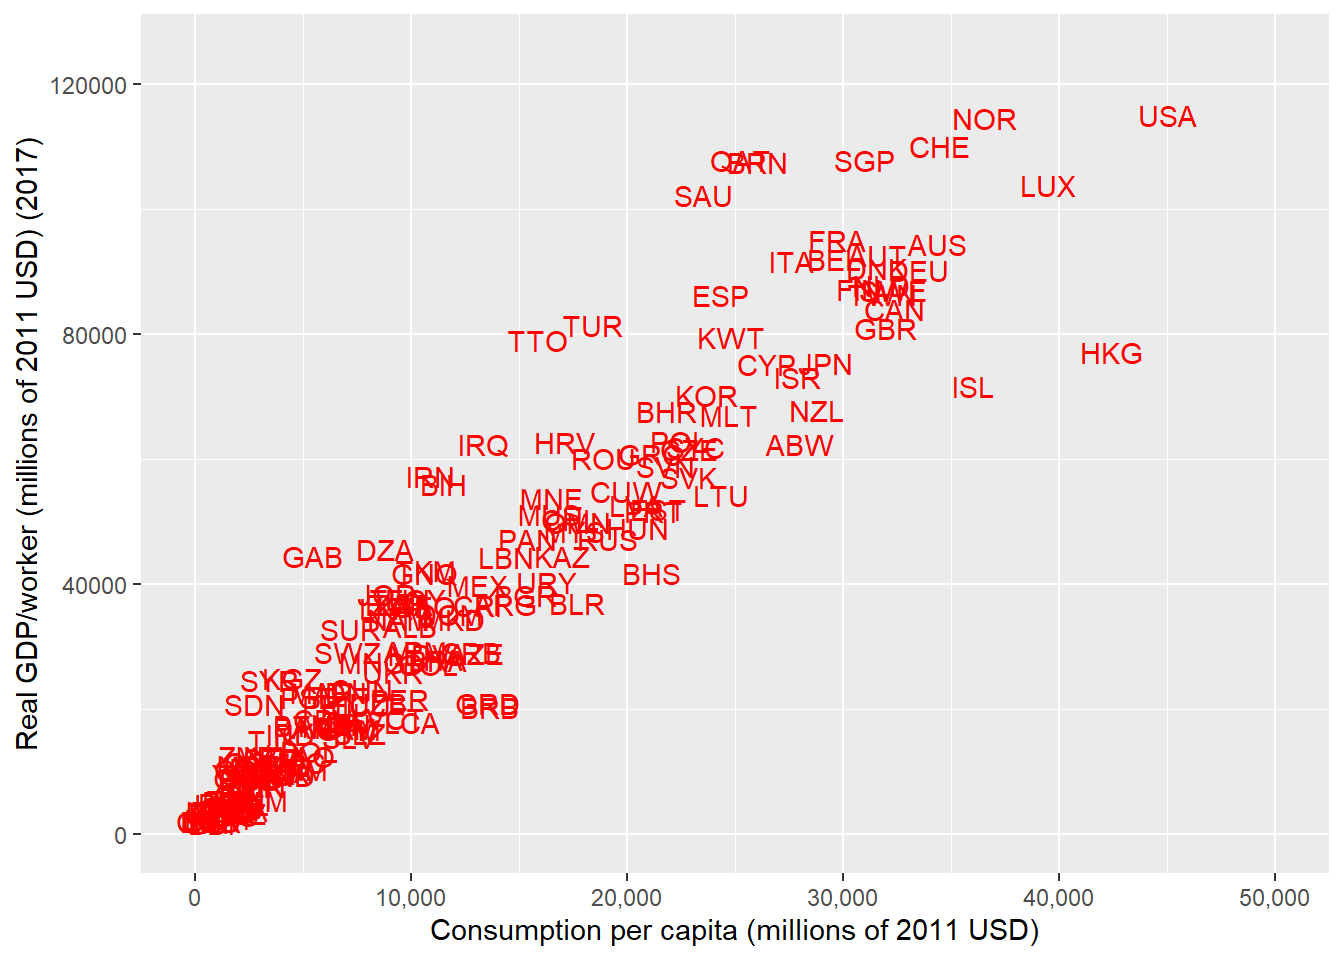
Should we care about whether or not countries are rich? That’s a normative question, and to an extent it depends on what we think people value. In general, though people do seem to like consumption, and it turns out that people who live in countries where their workers produce more also seem to be places where the average person consumes more.
Obviously, this doesn’t speak to all aspects of human welfare, or to the distribution of resources within societies. It’s a very incomplete picture of whether growth matters for human flourishing. But if consumption is related to welfare, then we should care about growth in GDP/worker so we can understand welfare as well.
1.4 Fact 4: Rich countries tend to grow at a similar rate
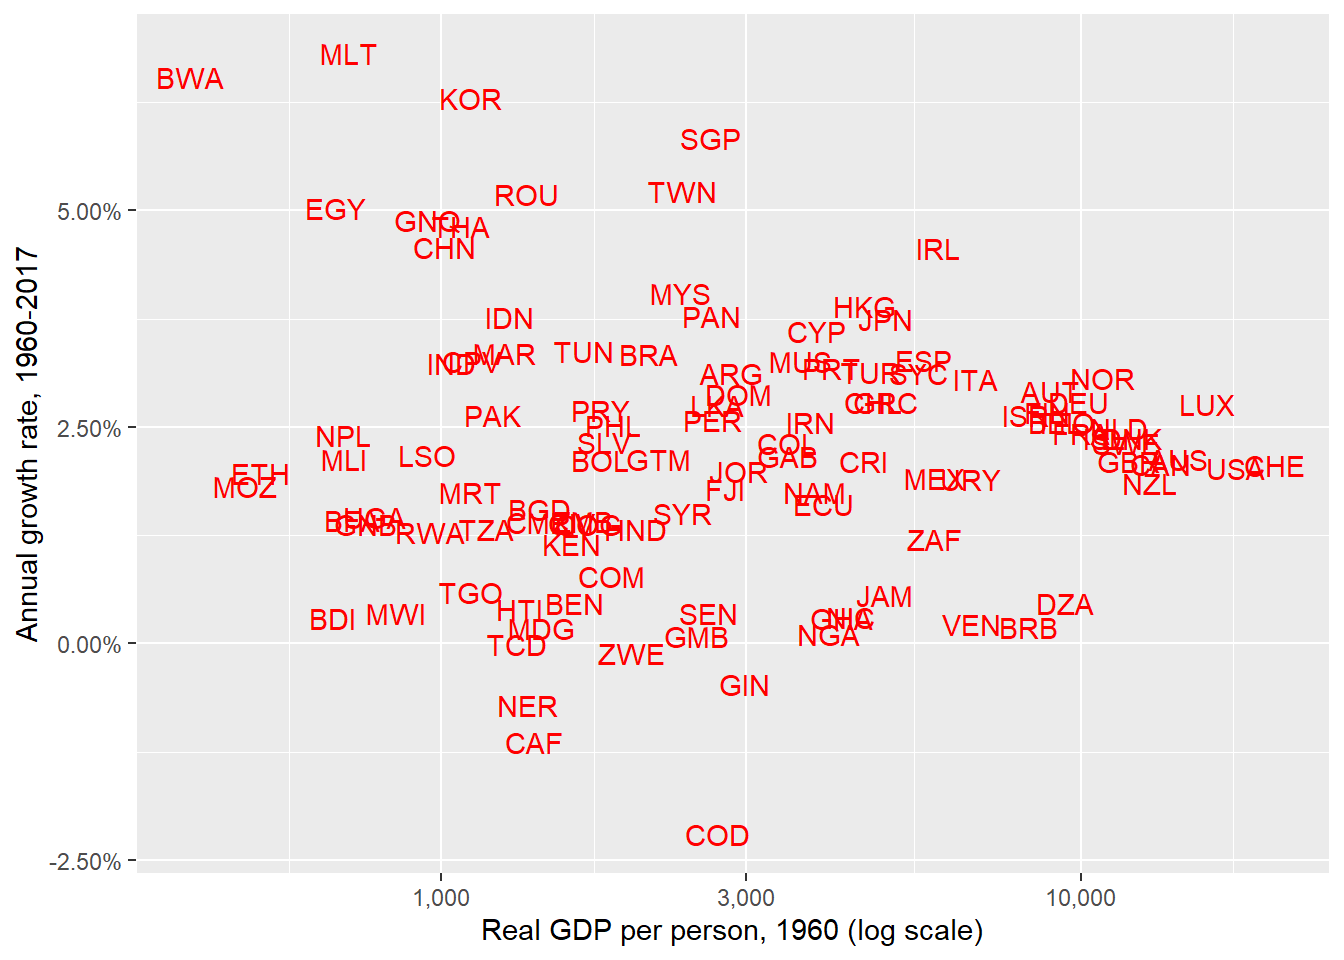
Many economies - especially the richest - seem to grow at similar rates. Although this phenomenon –called “convergence in growth rates” — can be made more nuanced, in general we might want a growth model that correctly predicts that a country like the United States and a country like Germany grow at similar rates. We can see this fact by looking at the following scatterplot. The horizontal axis is GDP per worker (on a log scale) in 1960. The vertical axis measures the annual (exponential) growth rate from 1960-2019. Countries that were already (relatively) rich in 1960, in general, grew at relatively similar rates after 1960.
1.5 Fact 5: Countries at a similar level of economic development often have similar geographic, institutional, and cultural characteristics, as well as similar policies.
In an effort to explain facts 1-4, economists have examined a number of “fundamental” causes of growth. For example, it may seem unsatisfying to say that countries that are more productive are richer. Assuming the increased productivity causes countries to be rich, the natural question is “why are countries more productive?” Productivity is a ``proximate’’ cause of growth; we’re interested in fundamentals.
The Solow model only tells us about proximate causes. At the end of this mini-textbook, we discuss some theories of about differences in things like productivity and savings rates. We can preview those theories by noticing that countries with a higher level of GDP per worker tend to have geographic, institutional, and cultural features in common.
Below, we’ll discuss a few examples; there are many others.
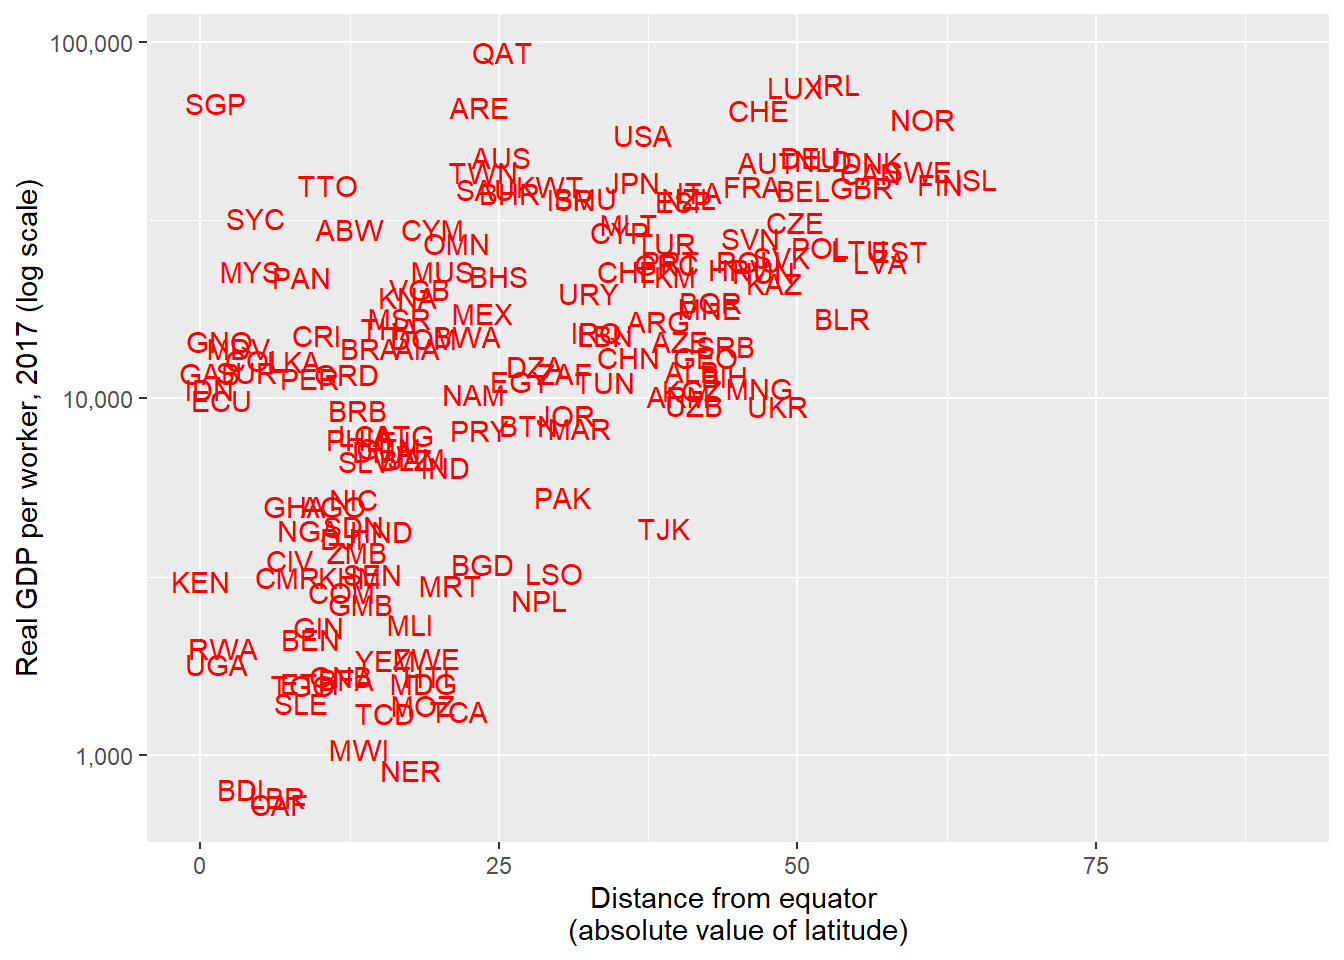
1.5.1 Rich countries tend to be further from the equator
As we can see from the below plot, real GDP per capita tends to be higher in countries located at a higher (in absolute value) latitude - that is, countries further from the equator.
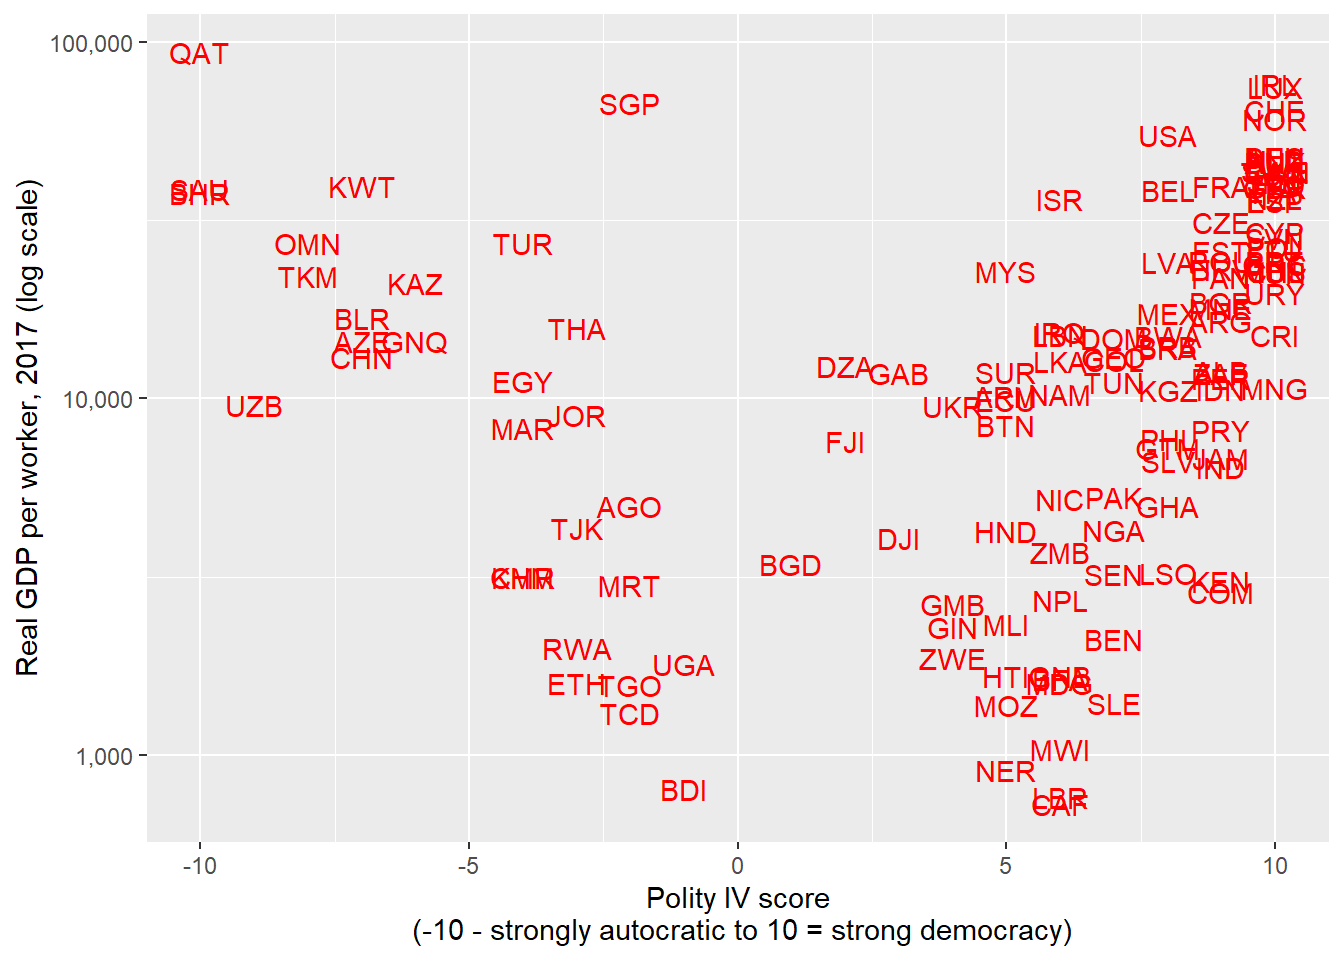
1.5.2 Rich countries tend to have more democratic governments
Many different features of formal and semi-formal institutions have been related to long-run growth. For instance, the Center for Systemic Peace (a research nonprofit) has compiled a historical dataset ( Polity IV ) on the extent to which governments are characterized as democratic versus autocratic. The scores run from -10 (strongly autocratic) to 10 (strongly democratic). Broadly speaking, rich countries (on a per capita basis) tend to be closer to the strongly-democratic end of the spectrum. The big exception is that there are some extremely rich (on a per capita basis), autocratic oil exporting states like Qatar.
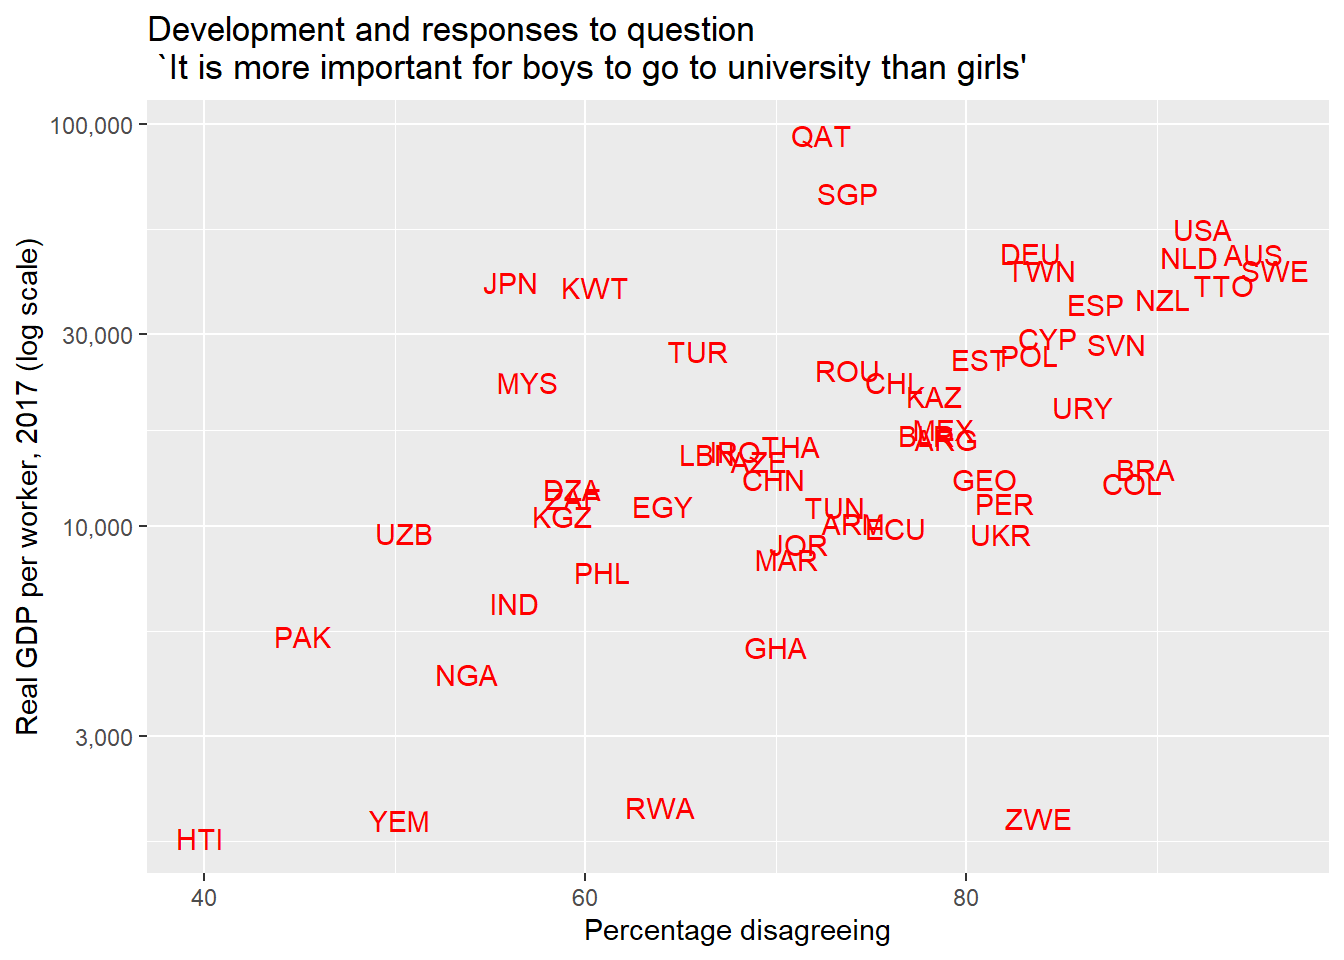
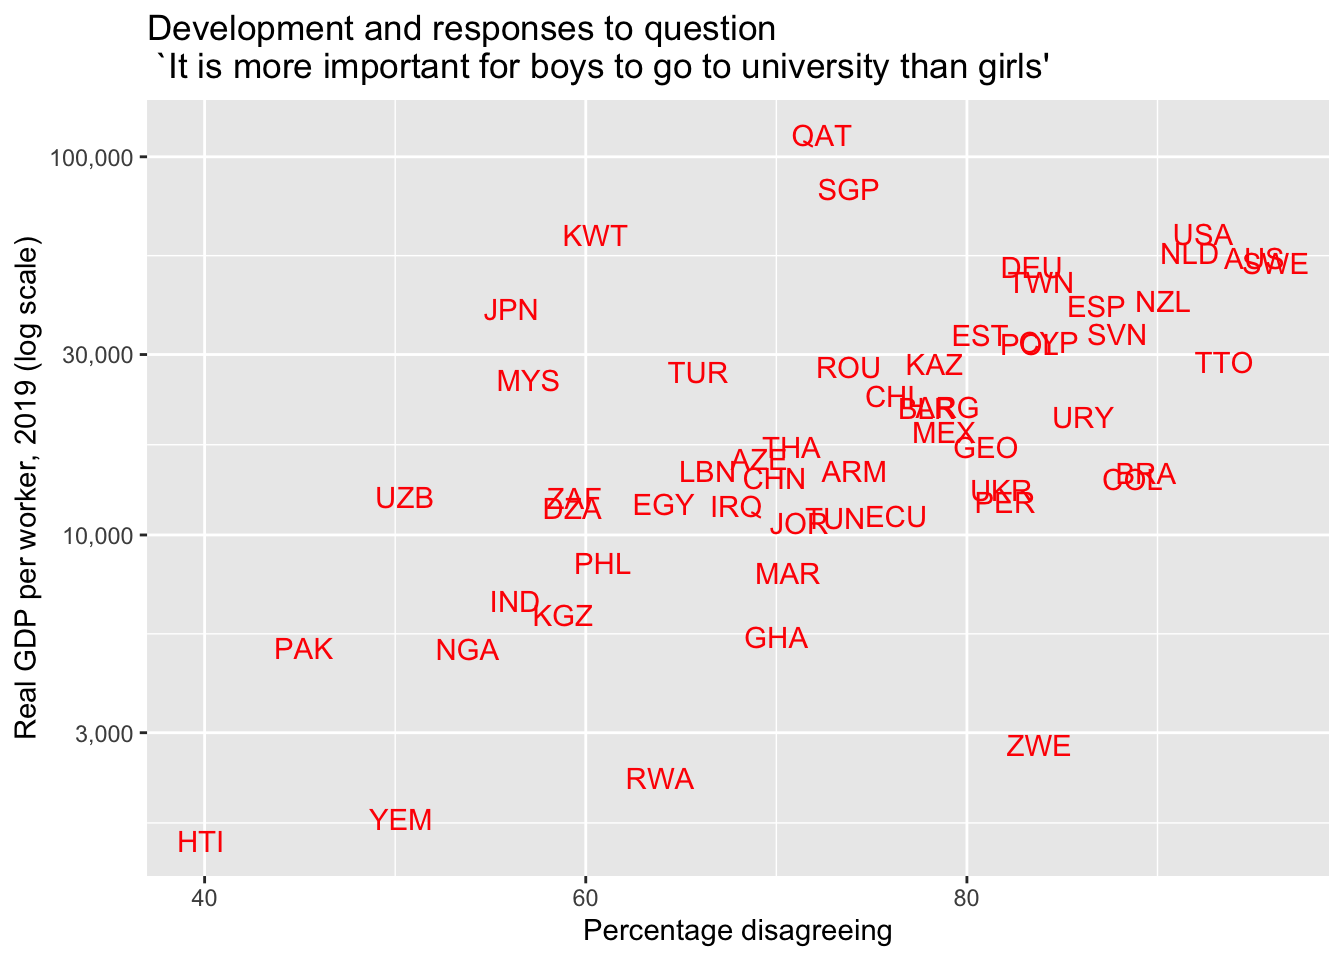
1.5.3 People in rich countries often express similar cultural attitudes
The World Values Survey, conducted since 1981, asks individuals questions about both what attitudes they cultivate in children, the importance of institutions like family or government, and a number of other questions that are broadly related to ``culture’’ - norms, attitudes, etc. Economists have explored whether peoples’ stated values are related to their stage of economic development. For example, it appears to be the case that people who live in countries with higher GDP per capita also tend to say that they think higher education is equally important for men and women.
1.6 Summing up the facts, and a word of caution
In this section, we’ve seen some suggestive evidence for facts about the distribution of income across countries, and what similarities rich (and poor) countries have with each other. Those facts were:
- Some countries are richer than others on a per-capita basis.
- The countries that are richer than others are similar in several dimensions:
- They tend to have more physical capital per worker.
- They save and invest at a higher rate than other countries.
- Their workers tend to have a higher level of education and are healthier (they have more human capital).
- They are better at transforming physical inputs into output than others (they are more productive).
- People who live in countries that are richer consume more on average.
- Rich countries tend to grow at similar rates.
- Countries at a similar level of economic development often have similar geographic, institutional, and cultural characteristics, and pursue similar policies.
If you’re interested in examining more model-relevant variables from the Penn World Tables in different years, you can use the following app to generate scatterplots:
We’ll next move to actually developing an economic model that we can relate to these facts.
It’s important to remember that these plots we’ve shown are essentially correlations; they show when two variables appear to move in similar directions on average. However, these kinds of plots can’t tell us about causal relationships - whether, for instance, countries are rich because they value gender equality or if it gender equality happens to be associated with some other social or economic that facilitates economic growth. Similarly, it could just be that democracies happen to be located further from the equator and the geographic and institutional correlations we observe are related to each other, without one obviously being the true cause of economic growth.
We would like to understand not just the what, but the why. The model we develop going forward makes certain claims about causality. We would want to have a more sophisticated set of tools than graphs to test whether those causal relationships are, in fact, true. This is the role of econometrics (which is a course you’ll take if you continue in economics!)
More briefly, the Nobel Laureate Robert Lucas wrote in 1988:
Is there some action a government of India could take that would lead the Indian economy to grow like Indonesia’s or Egypt’s? If so, what, exactly? If not, what is it about the ‘nature of India’ that makes it so? The consequences for human welfare involved in questions like these are simply staggering: Once one starts to think about them, it is hard to think about anything else. This is what we need a theory of economic development for: to provide some kind of framework for organizing facts like these, for judging which represent opportunities and which necessities.
A stylized fact is, more or less, something that is broadly true. The term is common in economics, and specifically originates from debates over macroeconomic growth theory. Nicholas Kaldor argued that theorists “should be free to start off with a stylised view of the facts – i.e. concentrate on broad tendencies, ignoring individual detail.” So while these facts are not true for every country at all times, they are broadly what we’ve come to expect↩︎
All of these comparisons are using real GDP, as measured using 2017 US dollars adjusted for purchasing power parity (roughly, adjusting for differences in price levels across countries).↩︎
Of course, this doesn’t say anything about the distribution of income within countries.↩︎
Since everything we can’t account for gets thrown in with productivity, it is sometimes called the “Solow Residual.” The economist Moses Abramovitz referred to it as “the measure of our ignorance.”↩︎