5 Dynamics: What happens over time when parameters change
Before, we thought about using the Solow model two compare two countries that were identical, except one country had a different savings rate than another. But we could just have thought about it in terms of a single country that decided to save a different amount than it had in the past. We can also use the model to think about what happens over time in that country.
5.1 Changes in savings rates
Let’s go back to the previous example. Imagine the low savings-rate country decides to increase its saving. Graphically, we could depict this change as a shift in the investment curve. We know that the economy’s new steady state is at the intersection of the higher investment curve and the (same) depreciation curve. We want to explain intuitively how the economy gets from the old steady state to the new.
The verbal explanation would be:
At the “old” level of capital per worker, the economy jumps from the old to new investment curve. Because investment is now greater than depreciation at this level of capital per worker, the economy begins to accumulate more capital per worker. This means that the economy produces more. The process of growth of the capital stock and greater output continues over time, with the additional output gained diminishing as capital per worker increases. Eventually, the country reaches the new steady state where depreciation is equal to the new, higher level of investment.
If we were to look at data for this country, we would see that their level of investment (per worker) initially increases. We would then observe (in per worker terms) capital, output, investment, and depreciation increasing over time. The initial increase in investment (and output) is large, but gradually slows (because of diminishing marginal returns), until growth stops once the economy reaches the new steady state.7
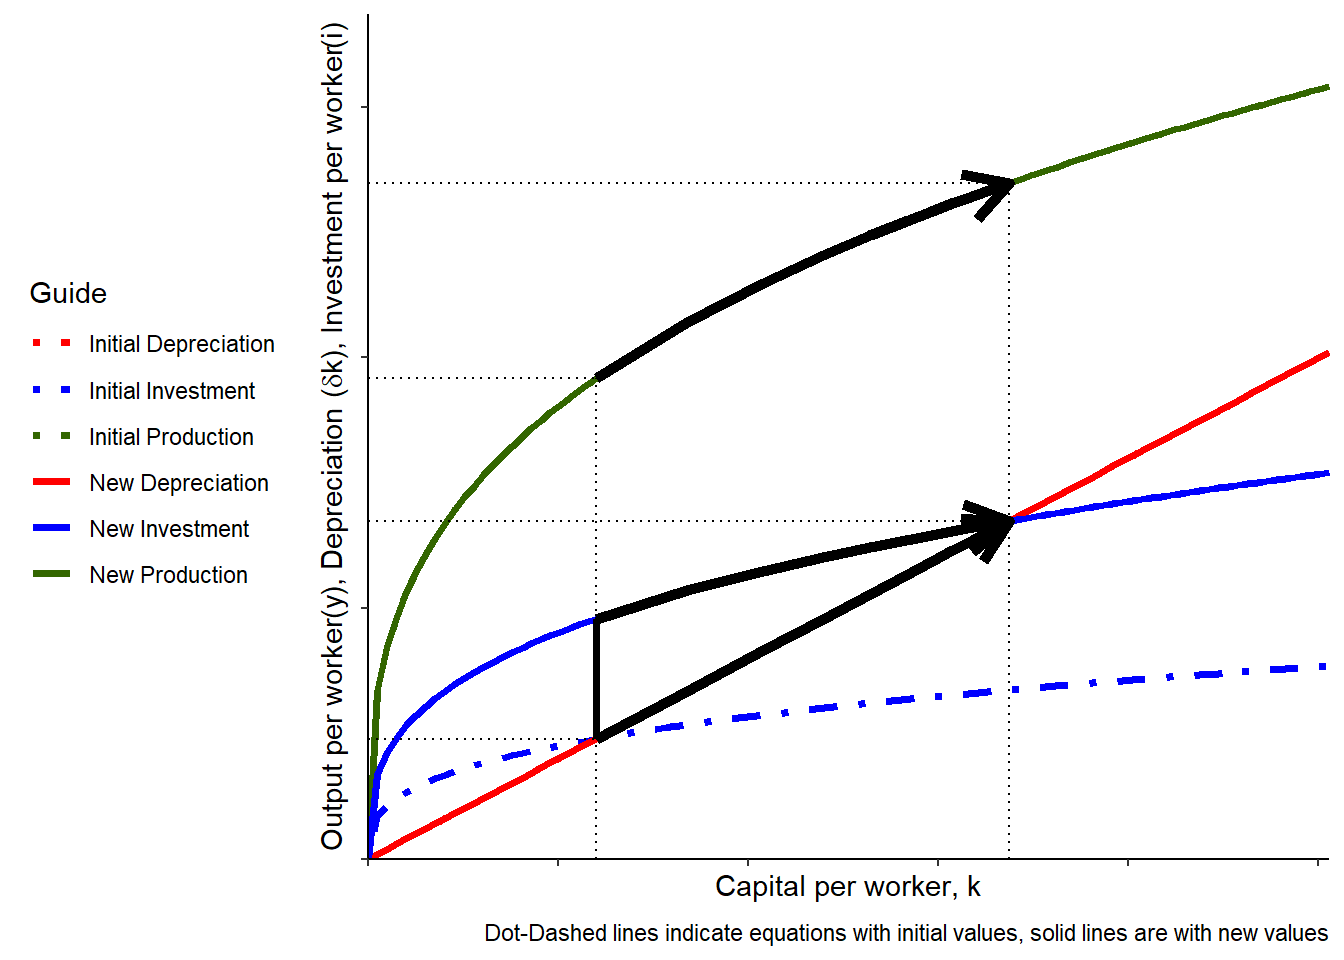
5.2 Changes in productivity: Preview
Suppose that, due to an improvement in efficiency, a particular country becomes more productive. How would we depict this graphically and describe the change over time?
Exercise:. Draw, and describe intuitively, how a change in productivity affects capital per worker, output per worker, investment per worker, and consumption per worker in a country over time.
This gives us some insight about how consumption will evolve. Initially, it drops because savings have increased. It begins to increase from its new low level over time because output per worker is gradually increasing. It may or may not reach (or surpass) its level at the old steady state depending on how much savings change and the rate at which returns are diminishing)↩︎