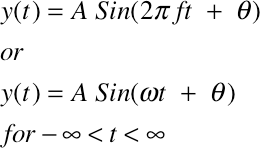
The general formula for a continous sinusoidal waveform is:

t |
is a continuous time variable |
A |
is the amplitude |
2π |
is one period of a phasor rotating around the unit circle |
f |
is the frequency of the phasor rotation in Hz |
θ |
theta is the starting phase of the phasor. If θ is zero we get a sine wave, if θ is π/2 we get a cosine wave. |
ω |
omega = 2πf and is referred to as the angular frequency |
The general formula for a discrete (sampled) sinusoidal waveform is:

n |
is a positive integer |
A |
is the amplitude |
2π |
is one period of a phasor rotating around the unit circle |
f |
is the frequency of the phasor rotation in Hz |
SR |
SR is the Sample Rate in samples per second |
T |
T = 1/SR is the sample period |
θ |
theta is the starting phase of the phasor |
ω |
omega = 2πf and is referred to as the angular frequency |
We'll use the Audio CD sample rate (SR) of 44100 samples per second.
The sample period (T = 1/SR) is 0.000022675736961 seconds or about 1 sample every 22.67 microseconds. The cost of digital audio recording equipment is related to how accurately the sample period is maintained.
Open a new Excel worksheet and enter these names in column A.
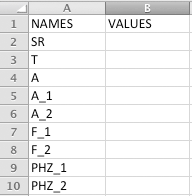
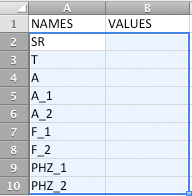
Select cells A2:B13.
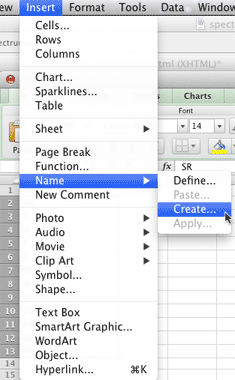
Choose Name/Create from the Insert menu.
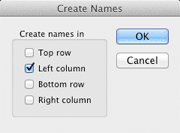
When the Create Names dialog appears make these settings and click OK.
Enter these values/formulas in Columns B
A |
B |
|
1 |
NAMES | VALUES |
2 |
SR | 44100 |
3 |
T | =1/SR |
4 |
A | 1 |
5 |
A_1 | 1 |
6 |
A_2 | 1 |
7 |
F_1 | 10 |
8 |
F_2 | 20 |
9 |
PHZ_1 | 0 |
10 |
PHZ_2 | 0 |
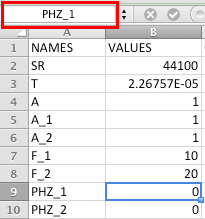
If you scroll down the empty cells in column B you should see the defined names appear above column A.
Add these comments to column C.
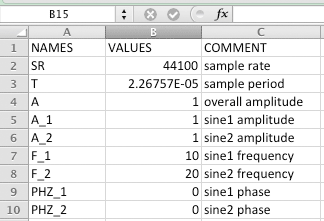
Save As lab12_3sineWave.xlsx.
![]()
One second of sound requires 44100 samples. We're going to create a half second of sound with 22050 samples.
Enter a zero in D2.
Select D2.
Choose Fill Series from the Edit menu and make these choices. The stop value is 22049 because we started at 0.
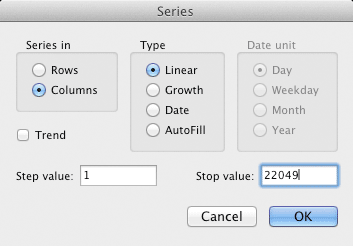
Column D shows a series of 22050 integer sample numbers from 0 to 22049. These numbers represent the n in the general sine wave formula.
The actual sample values for SINE 1 will be stored in column E.
We need to translate the general sine wave formula into Excel.
![]()
Using our defined names, the Excel PI() function for π, and the fact that Column D represents n, we get
=A_1 * SIN( 2 * PI() * F_1 * D2 * T + PHZ_1)

E0 now holds the sample value for y(0).
Column F will hold the sample values for SINE 2
You'll see this. F_1 is sin1 frequency, PHZ_1 is sin1 phase, T is the sample period, 0.00002267 seconds or 22.67 microseconds.
=A_1 * SIN( 2 * PI() * F_1 * E2 * T + PHZ_1)
Change every _1 to _2. F_2 is sin2 frequency, PHZ_2 is sin2 phase.
=A_2 * SIN( 2 * PI() * F_2 * E2 * T + PHZ_2)
There's still a problem. Can you spot it? The formula references E2 for the sample values but it should be D2, the integer sample numbers. The correct formula for F2 is this.
=A_2 * SIN( 2 * PI() * F_2 * D2 * T + PHZ_2)
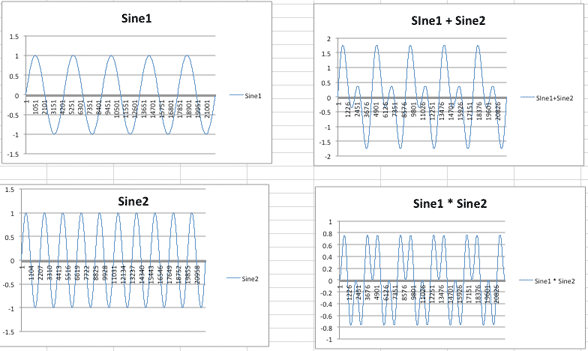
You add sine waves by adding their samples. This is called Additive Synthesis.

You multiply sine waves by multiplying their samples. This is called Modulation Synthesis.

You can have Excel calculate the 2205o*4 samples in columns E, F, G, and H very quickly. The next step will make it easier.
Scroll down to row 22051. Remember the column selection shortcut?
Shortcut: Select D2. Hold down the the Command (Apple) and Shift Keys and press the down arrow.
Sample 22049 should be visible. Enter something (I used ones) in columns E F G H for the last row.

Scroll back to the top.
Select E2:H2.
Copy.
Hold down the the Command (Apple) and Shift Keys and press the down arrow.
E2:H22051 should be selected.
Paste.
After a few seconds E2:H22051 should be filled with values.
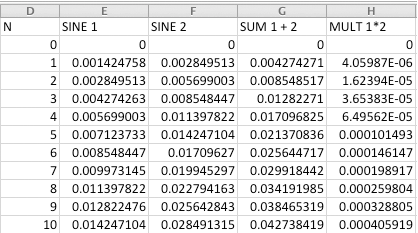
Select E2.
Use the shortcut to select E2:E22051.
Copy. (This is a shortcut to scroll back to the top. You're not going to paste anything.)
Click the Charts tab and choose the Line style.
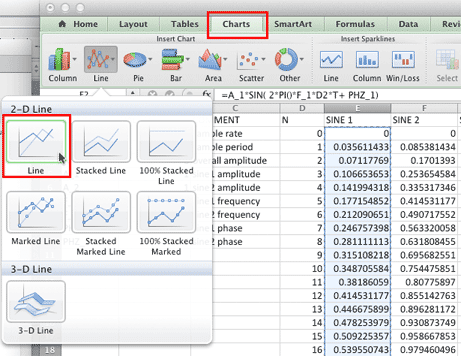
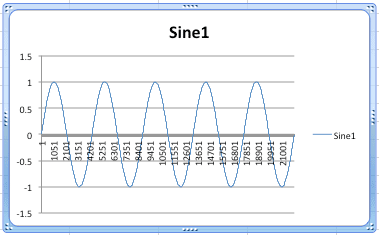
You should see this chart appear.
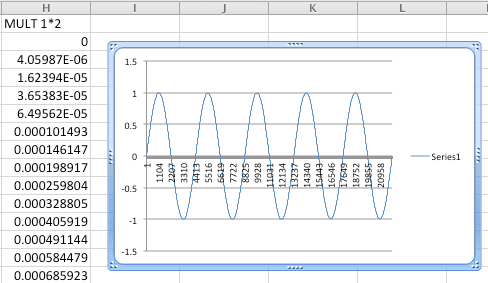
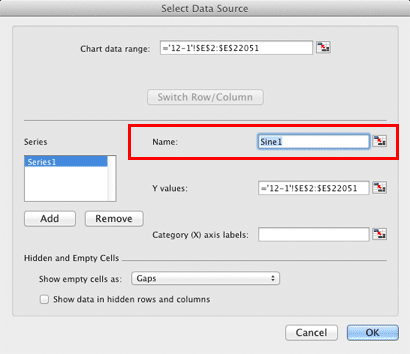
Right click anywhere within the chart and choose Select Data from the popup menu. (If right click doesn't work, try holding down the Control key before and during the click.)
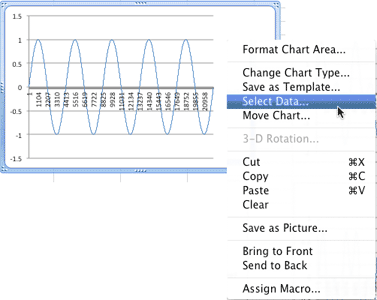
When the Select Data Source dialog appears, enter Sine1 as the chart name.
Viola.
Create and name charts for columns F, G, and H. Arrange the four charts like this.
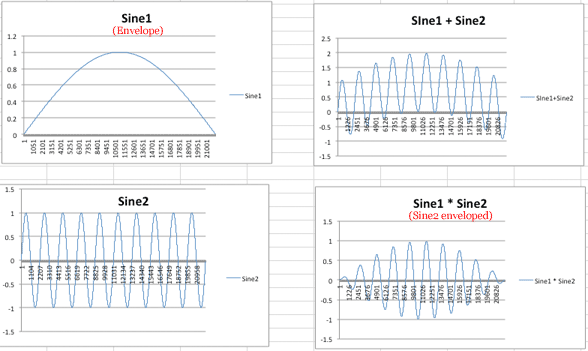
Envelope functions are unipolar functions with values between zero and one. Unipolar means the function stays on one side of the X axis, in this case above. Bipolar functions cross the X axis and have positive and negative values.
Change the Sine 1 frequency (B7) to 1 Hz. Sine1 is now an envelope function. When Sine2 is multiplied by Sine1, the amplitude values of Sine2 conform to the amplitudes of the Sine1 envelope. The four graphs should update and look like this.
Change Sine1 frequency (B7) to 0.5 Hz.
Change the Phase1 (B9 ) to the formula =PI()/2.
The envelope is now one quarter of a cosine wave. The four graphs should look like this.
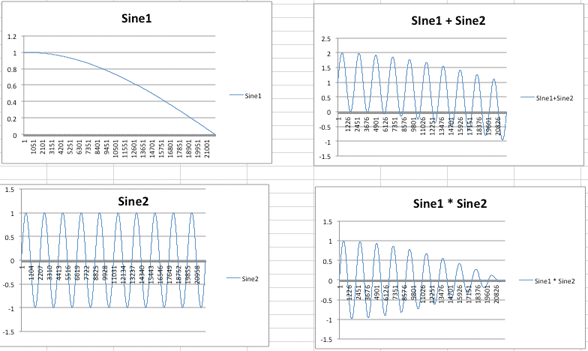
Save, keep the spreadsheet open, and continue with 12Lab4.
Revised John Ellinger, January - September 2013