In 12Lab4 you'll hear waveforms you created in Lab3.
The Excel Spreadsheet lab12_3sineWave.xlsx should still be open.
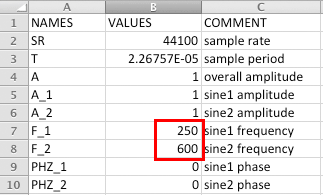
Change F_1 to 250 Hz and F_2 to 600 Hz.
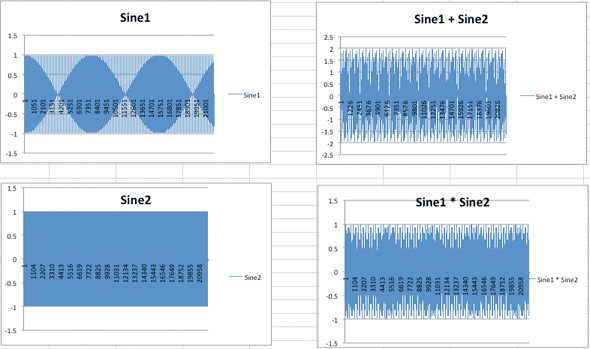
The graphs should update.
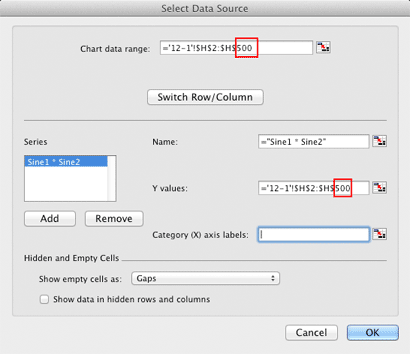
Note: You can choose the amount of data to display in each graph. Right click (or Control click) in the Sine1*Sine2 graph and choose Select Data. In the Select Data Display dialog change the $H$22050 item to $H$500.
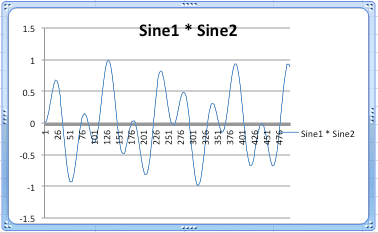
Graph 4 now shows the first 499 data points.
Open a new blank document in TextWrangler.
Copy Excel samples E2:E22051 and paste them into TextWrangler.
Save the TextWrangler file to the Desktop as sine1.txt.
I wrote a small command line tool called xl2wav that converts the Excel samples into a binary data file that can be opened and played in Audacity.
Open Terminal and enter these commands. Tilde ~ represents your home folder.
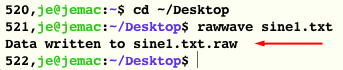
$cd ~/Desktop
$ xl2wav sine1.txt
Terminal should repspond with Data written to sine1.raw.
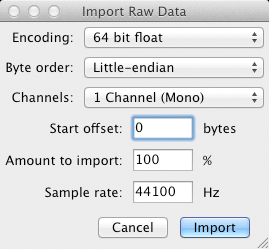
Choose Import/Raw Data... from the File menu.

Import the "Desktop/sine1.txt.raw" file.
The Import Raw Data dialog will appear. The default settings should be correct.
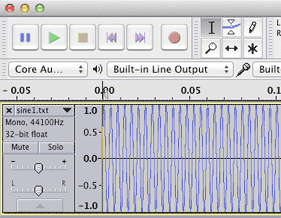
You should see this.
Save them all to the Desktop with unique TextWrangler file names.
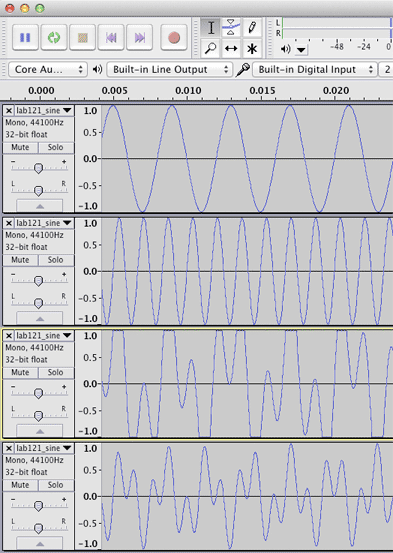
After importing all files into Audacity you should see this.
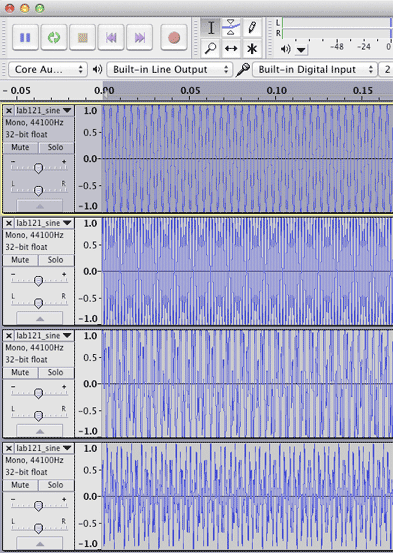
Using the Solo button, play each waveform.
Number three doesn't sound good, it's distorted.
Let's Zoom in on the waveforms. Notice that waveform three has been clipped. The tops and bottoms of the waveform are flat. That causes the distortion. The reason is that Sine1 and Sine2 both had amplitudes of 1.0. When they were added together, amplitudes that were greater than 1.0 were clipped.
Delete waveform 3 in Audacity by clicking the X in the upper left corner of the track info panel.
Back in Excel, look at the graph of Sine1+Sine2. It's clipping, the sample values exceed ±1.
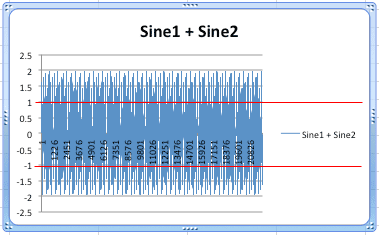
The Excel formula for Sine1+Sine2 was: =A*(E2+F2)
A is a defined name representing the overall amplitude. Change B4 to 0.45 and the clipping is gone.
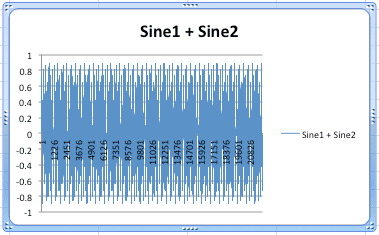
Import the new column G data into Audacity. Listen to the Sine1+Sine2 track again. The clipping should be gone.
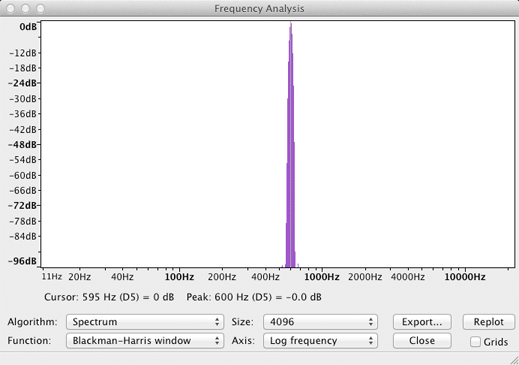
Sine 1 displays one peak at 250 Hz.
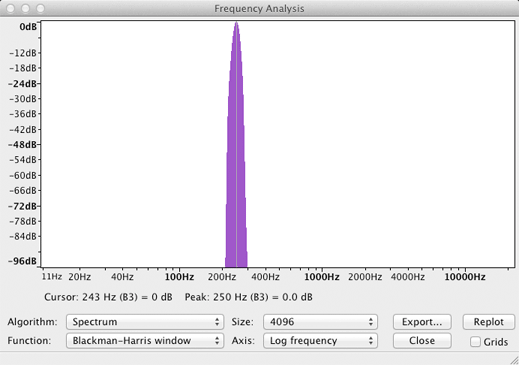
Sine 2 displays one peak at 600 Hz.
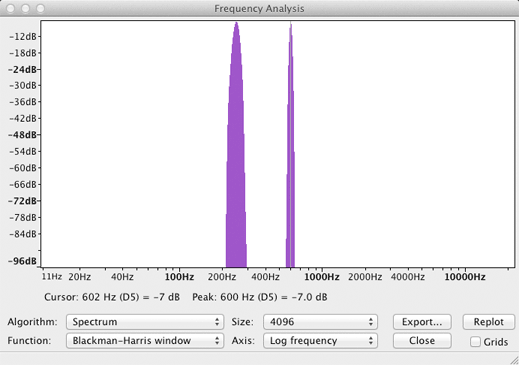
Sine1 + Sine2 displays two peaks at 250 Hz and 600 Hz.
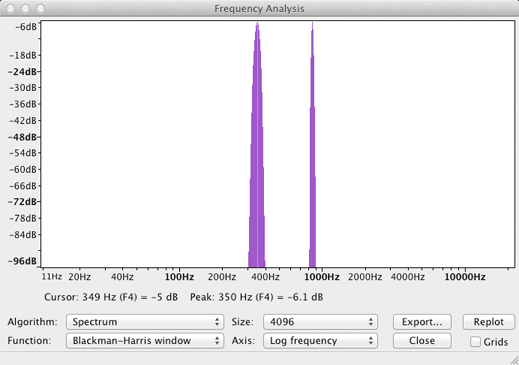
Ring Modulation multiplies two waveforms together. The output is the sum and difference of the two frequencies. This corresponds to the trigonometric identity for multiplying two sine or cosine waves. The fundamental frequencies (A and B) of each waveform will be missing.
Sine1 * Sine2 displays two peaks at 350 Hz (600-250) and 850 Hz (600+250).
MUSC 208 winter term will go into digital audio, signal processing, and synthesis in more detail.