
In unit 11-13 labs and your second take home quiz you'll be working with the open source audio editor Audacity. You can download and install it on your computer from http://audacity.sourceforge.net/. The current version is 2.0.4.
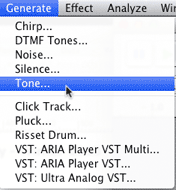
Open /Applications/ Audacity and choose Tone from the Generate menu.
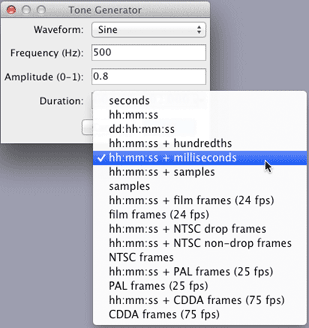
Choose hh:mm:ss +milliseconds from the Duration popup menu.
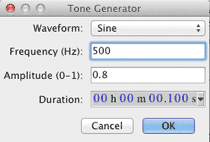
Set the Frequency to 500 and click OK
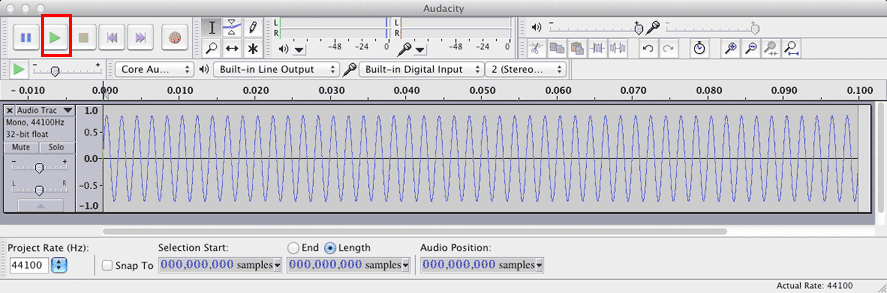
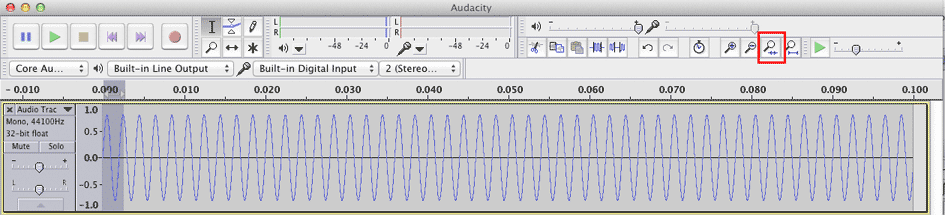
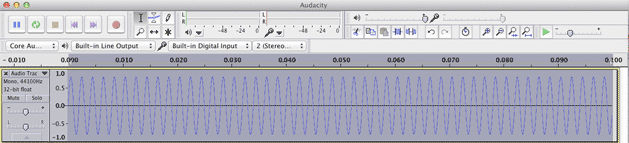
One hundred milliseconds of a 500 Hz sine wave will be shown in the Audacity window.
Click the Play button.
A very good description of the Audacity interface is found at: http://manual.audacityteam.org/o/
An open source user manual for Audacity is found at: http://en.flossmanuals.net/audacity/
In Lab 7 these are the tools we'll use.
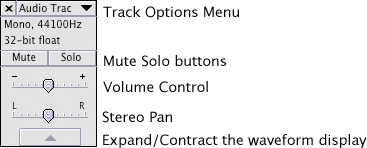
You'll rarely need to change these.
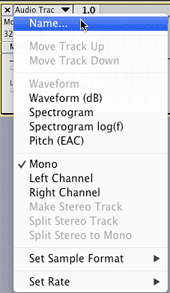
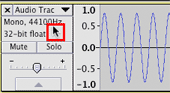
The standard setting for Set Sample Format is 32 bit float. The standard setting for Set Rate is 44100 Hz.
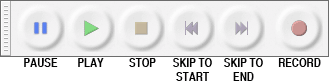 http://manual.audacityteam.org/o/man/transport_toolbar.html

| Icon | Name | Description |
| Select | The main tool used to select audio. |
|
| Zoom | Select a portion of the waveform to zoom in on. | |
| Time Shift | Move audio an region to a new time position. |
![]()
| Icon | Name | Description |
| Zoom In | Zoom in on the selected refion of the waveform eventually reaching the individual sample level. | |
| Zoom Out | Zoom out. | |
| Fit Selection | Fit the selected region to the width of the window. | |
| Fit Project | Fit the entire project to the width of the window. |
Experiment with these tools now.
When you're done, click the Fit Project tool.
Frequency and period are inversely related.
 |
and |  |
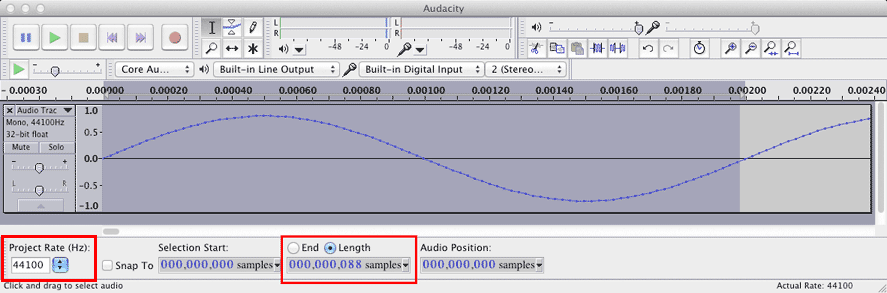
Select a little more than one period of the sine wave and click the Fit Selection tool.
Refine the selection to include exactly one period. Set the Length popup menu to display samples.
If you know the Sampling Rate and the number of samples in one period of the waveform you can calculate its frequency.
We'll be using the CD audio sampling rate or sampling frequency of 44100 Hz. The sampling period is the reciprocal of the sampling rate. By convention we'll use SR for sampling rate and T for sampling period.
| and | 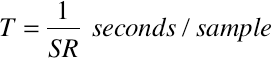 |
One period of our sine wave is 88 samples long. You can calculate the frequency like this.
| SR | 44100 samples/second | sampling frequency |
| T | 1/44100 seconds/sample | duration of one sample |
| P | 88 * T | figure it out |
| F | 1/P | figure it out |
Alternatively you can calculate the frequency like this.
| SR | 44100 samples/second | |
| P | 88 samples/period | |
| F | SR/P (periods/second) | figure it out |
We know the frequency should be 500 Hz but that's not what the calculation showed. We'll need to refine our calculation.
Use the Zoom tool ![]() to select a very small region just before and after the start of the second period.
to select a very small region just before and after the start of the second period.
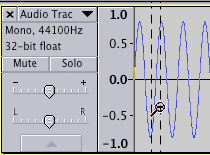
Further refine the selection by selecting four samples starting with sample 87.
If you calculate the frequency for periods of 88 and 89 samples you get:
| Period in Samples | Calculated Frequency |
| 88 | 501.14 |
| 89 | 495.50 |
The true frequency lies somewhere between a period length of 88 and 89 samples. Because the Sine wave phase was zero, the first period started with sample value zero. We're looking for the zero crossing point between sample 88 and 89.
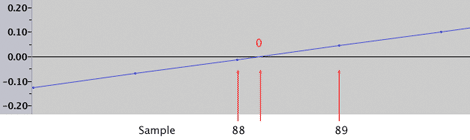
Guessing that the zero crossing is about 1/4 of the way between 88 and 89 lets say the period is 88.25 samples. That's pretty close to 500 Hz.
| Period in Samples | Calculated Frequency |
| 88.25 | 499.72 |
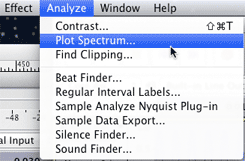
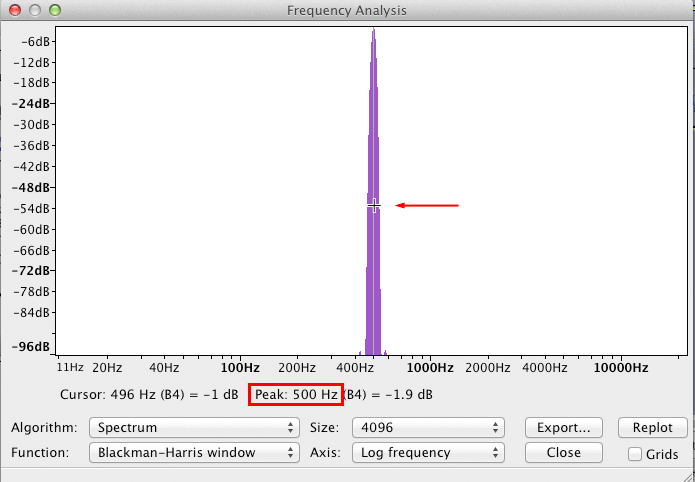
The most common way to display frequency components of an arbitrary waveform is to use the Fast Fourier Transform. The FFT is a mathematical transform that converts a sampled sound from the time domain into the frequency domain. A graph of the FFT output displays the individual frequencies found in the sound. In Audacity the FFT is invoked using the Plot Spectrum menu command in the Analyze menu.
Click here in the Track Control Panel to select the entire waveform.
Use the Fit Project tool ![]() to display the entire waveform.
to display the entire waveform.
Choose Plot Spectrum from the Analyze menu.
When the Frequency Analysis window appears make these settings for Algorithm, Function, Size, and Axis. Position the cursor in the center of the frequency spike and read the Peak value of 500 Hz.
Continue with 11Lab2.
Revised John Ellinger, January - September 2013