Switched On Sound 01: Sound and Hearing
Switched On Sound 02: Describing Sound
Sound waves create pressure differences in the air. These pressure differences are analogous to ripples that appear when a small stone is thrown in water. The troughs and valleys of the wave spread out from the center in all directions. A slice through the waves into the center reveals sinusoidal motion and its associated amplitude and frequency. Our eardrum is very sensitive to pressure differences in the sound wave. Through a complex process in the inner ear and neural pathways, we hear the sound. The range of human hearing is approximately 16 Hz to 16000 Hz. As we get older the upper range of hearing diminishes.
Sinusoidal signals are one of the fundamental building blocks of digital sound. All musical sounds with a discernable pitch can be broken down into a sum of sine and cosine waveforms.
Pitch and frequency are often thought to be synonymous. However, there is a subtle distinction between them. Most musical tones are a mixture of several frequencies. These frequencies are related by integer multiples of a fundamental frequency forming a pattern called the harmonic series that will be discussed shortly. A pure sine wave is the only sound that consists of one and only one frequency. The modern standard of pitch is based on a frequency of 440 Hz (the note A above middle C) and is the tuning reference for all modern musical instruments.
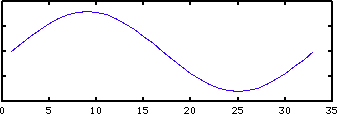
An analog signal is a continuous signal like the voltage changes produced by a microphone. When graphing an analog signal, the x axis represents time and the y axis represents amplitude. Analog signals are continuous in the mathematical sense that a y value exists for every x value.
Digital signal are discrete signals that are sampled in time. The sample times are uniformly spaced on the x axis and a y value only exists at those points and is undefined between them.
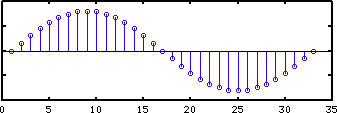
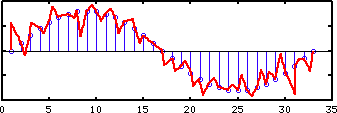
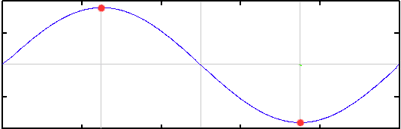
While it's tempting to think that the original signal must have been a sine wave
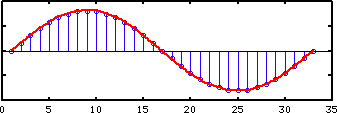
it could also have been a very jagged wave because we don't know what happened between the sample points.
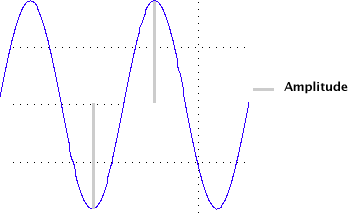
Amplitude refers to the displacement of the waveform above or below the x axis. Sound waves with a large amplitude are loud, those with a low amplitude are soft. Amplitude is measured in decibels (dB). Decibels will be covered in Unit 8.
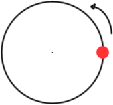
Sine waves and circular motion are closely related. Imagine a pen attached perpendicular to the edge of a rotating disc in contact with a moving sheet of paper. As the disc rotates and the paper moves, a sine wave will be drawn.
Circular motion animation example
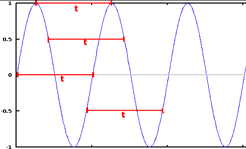
A signal is periodic if there is some unit of time, t, such that signal(x) = signal(x+t) for all x. The time t is called the period. All sinusoidal signals are periodic. The period of the sine wave is 2π because sin(x) = sin(x+2π) for all x.
Imagine the red dot on the edge of the disc as it rotates past a fixed point. If the red dot passed the pointer 100 times in one second the speed of rotation is 100 cycles per second, or more correctly a frequency of 100 Hertz (Hz).
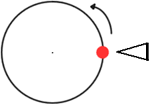
The time it takes for one complete revolution is called the period. If you know the period, you also know the frequency because frequency (f) and period (T) are inversely related.
![]()
Speed is measured as distance traveled per unit of time, as in miles per hour or meters per second. If the red dot is on the edge of a circle of radius r units, then it travels 2πr units in one revolution, or one period. At a given frequency f , the red dot travels 2πrf units per second. Let's say the radius of the circle is 1 foot and the disc is rotating at 440 Hz. The red dot will travel 2π * 1 * 440 = 2764.4 feet in one second, 165,876 feet in one minute, 9,952,560 feet in one hour or 1885 miles per hour. If the radius of the disc was 2 feet, everything would double.
In digital audio the question is not how far something has traveled, it's how fast it's rotating. That's called angular frequency and is measured in radians. One radian equals the angle formed between the x axis and the radius of a circle when the arc length is equal to the radius. The circumference of a circle is equal to 2π radians 0r 360 degrees. Therefore, one radian is 57.296 degrees (360/2π) and one degree is 0.017453 radians (2π/360). The greek letter ω (omega) represents angular frequency and is equal to: ω = 2 π f.
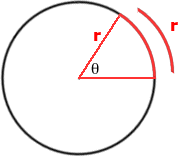
Imagine the radius as the spoke of a wheel spinning counter clockwise around the center of the circle. The angle formed by the radius and the x axis is constantly changing and the number of radians swept by the angle is constantly increasing. Angular frequency is measured in radians per second. Radians are independent of the radius. One revolution is always 2π radians. Multiply the frequency by 2π and you get the angular frequency or the radian frequency.
A frequency of 440 Hz is equivalent to:
Phase refers to the starting point of the sine wave. In the world of digital sound phase is measured in radians. Sine waves and cosine waves are π/2 radians or 90º out of phase with each other.
![]()
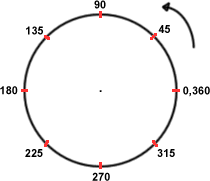
This table shows phase relationships between fractions of one revolution, degrees, and radians.
 |
Units | Values |
||||||||
| Revolutions | 0 | 1/8 | 1/4 | 3/8 | 1/2 | 5/8 | 3/4 | 7/8 | 1 | |
| Degrees | 0º | 45º | 90º | 135º | 180º | 225º | 270º | 315º | 360º | |
| Radians | 0 | π/4 | π/2 | 3π/4 | π | 5π/4 | 3π/2 | 7π/4 | 2π | |
Here are eight sine wave plots with each plot shifted by π/4 radians.
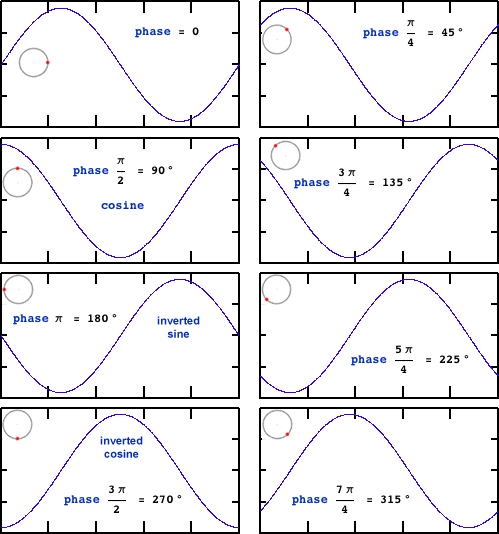
The phase of a waveform appears to have no effect on its sound. However when a waveform is combined with a copy of itself phase shifted by 180º, the two waves cancel each other out and nothing will be heard.
In the formulas below:
The general formula for a sampled sine wave is:
![]()
The formula is often expressed using the angular frequency symbol ω: = 2 π f
![]()
The formula can also be expressed like this.
![]()
When sound waves hit the diaphragm of the microphone the diaphragm moves. As the diaphragm moves it generates very small voltage fluctuations. The voltages are so small they need to be amplified to be useable. This amplification is done either through a microphone preamplifier or a mixing board. An Audio to Digital Converter (ADC) converts the amplified voltage signal into a stream of numbers. The ADC determines the rate at which the numbers are produced (sampling rate) as well as the minimum and maximum numbers that represent the gradations of the voltage changes (bit depth).
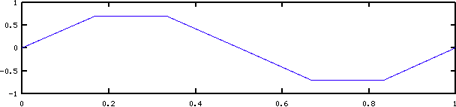
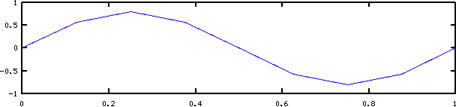
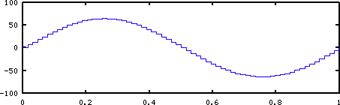
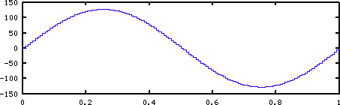
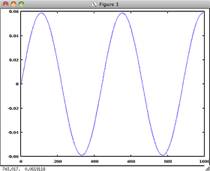
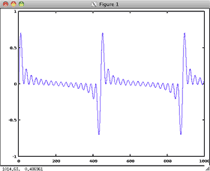
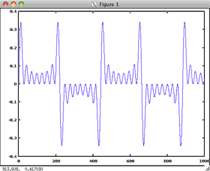
The number of samples taken per second is called the sampling rate. If the samples are uniformly spaced in time the sample period is the time between samples and is the reciprocal of the sampling rate. The higher the sample rate the more closely the digital sound represents the analog signal. The following plots show the effect of sampling a one second one Hz sine wave at different sample rates. You can see from the graphs that the more samples per second, the more accurate the sine wave.

Bit depth determines the minimum and maximum range of numbers and that represent the amplitude of the signal. The greater the bit depth, the more gradations there are between loud and soft passages. These plots show result of sampling a sine wave at various bit depths.
A bit depth of 4 can represent 2^4 = 16 values and has an amplitude range from -8 to +7.
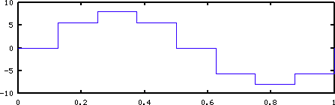
A bit depth of 6 can represent 2^6 = 32 values and has an amplitude range from-32 to +31.
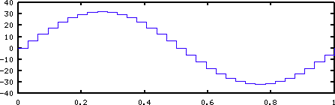
A bit depth of 7 can represent 2^7 = 128 values and has an amplitude range from -64 to +63.
A bit depth of 8 can represent 2^8 = 256 values and has an amplitude range from -128 to +127.
Audio CD's are sampled at a rate of 44,100 samples per second. The sampling frequency is 44100 Hz and the sampling period is 1/44100 or 0.00002267 second. That's over 22 samples every microsecond (millionth of a second).
The bit depth of an audio CD is 16 which means amplitude values can range from zero to 2^16 (65,636). In practice half the values are positive and half are negative shifting the range from -32,768 to +32,767. Bit depths of 24 are also used which represents 2^24 = 16,777,216 values that range from - 8,388,608 to 8,388,607.
This is the beginning of Duke Ellington's Don't Get Around Much Anymore, played at
different sampling rates and bit depths. The effects are most noticeable in the cymbals which have the highest frequency content. This example
is from a past student project.
| Sampling Rate | Highest Frequency | Amplitude | File Size | Play Sound |
| 44100, 16 bits | 22050 Hz | ± 32,767 | 3,145,772 bytes or 3.14 Mb |
|
| 22050, 16 bits | 11025 Hz | ± 32,767 | 1,572,908 bytes or 1.57 Mb |
|
| 11025, 8 bits | 5512 Hz | ±127 | 393,260 bytes or 393.2 Kb |
|
| 5512, 8 bits | 2756 Hz | ±127 | 196,634 bytes or 196.6 Kb |
|
Intuitively it takes two non zero points to sample one period of a sine wave. A more general question is: What is the minimum sample rate required to completely capture a signal whose highest frequency is f?
This question was answered by Harry Nyquist in a seminal 1928 paper. It is one of the fundamental principles of digital audio and is known as the Nyquist theorem. To be fair, it was independently discovered by others, but is still referred to as the Nyquist theorem. "In essence the theorem shows that an analog signal that has been sampled can be perfectly reconstructed from the samples if the sampling rate exceeds 2B samples per second, where B is the highest frequency in the original signal. If a signal contains a component at exactly B hertz, then samples spaced at exactly 1/(2B) seconds do not completely determine the signal." http://en.wikipedia.org/wiki/Nyquist–Shannon_sampling_theorem
The Nyquist rate is the minimum sampling rate required to completely capture the highest frequencies that occur in the sound to be sampled. If the highest frequency in the sound to be sampled is f, then the Nyquist rate is 2f. In practice the sampling rate is always somewhat higher than twice the highest frequency expected. The audio CD sampling rate of 44100 Hz will capture frequencies up to 22050, well above the range of human hearing. The Nyquist frequency is is equal to one half the sampling rate.
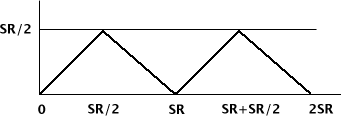
Aliasing occurs when an audio signal contains frequencies greater than the one half the sampling rate. If frequency f is less than one half the sample rate (Nyquist frequency), then it will be heard at its true frequency. If frequency f is above the Nyquist Frequency, it folds over and will be heard at the alias pitch of SR - f. This plot illustrates the what happens as frequencies exceed the Nyquist frequency. Frequencies from 0 Hz to the Nyquist frequency are heard at their true frequency. Frequencies from SR/2 Hz to SR Hz are heard as descending frequencies according to the formula SR - Freq. Frequencies from SR Hz to 2 SR Hz rise and falls similar to the 0-SR range.
According to the alias formula a frequency of 46100 Hz sampled at 44100 Hz will be aliased to a frequency of -2000 Hz. A negative frequency is a positive frequency phase shifted by 180º. In the circular motion analogy positive frequencies spin counter clockwise and negative frequencies spin clockwise. You can't hear the difference.
A microphone converts sound waves into an analog signal signal. That signal is amplified and passed through a low pass anti aliasing filter.
The Low Pass filter allows low frequencies to pass through the filter but is designed to block any frequencies near or above the Nyquist frequency to prevent aliasing. The signal then goes to the ADC.
The ADC converts the analog signal into a discrete digital signal at a given sampling rate and bit depth. The sampling rate and bit depth may be user adjustable. From there the signal goes to a DSP unit.
DSP refers to Digital Signal Processing. DSP units can be standalone hardware, or the computer itself. DSP effects take the stream of samples as input, modify the samples in some way and return the modified stream of samples as output. Common DSP effects can amplify the sound, change the duration, change the pitch, add reverb and EQ or play the samples backwards. The processed signal is almost ready to be played but first it needs to be passed through the DAC.
The DAC converts the processed digital signal back into a an analog signal. Sometimes effects processing adds frequencies above the Nyquist frequency that need to be filtered before playback. The signal is sent through another low pass filter.
This Low Pass filter removes those unwanted frequencies and is sometimes called a smoothing filter. The signal is once again an analog signal that can be sent to the output device.
This sampled, processed, smoothed, and reconstructed signal can finally be heard through speakers or headphones.
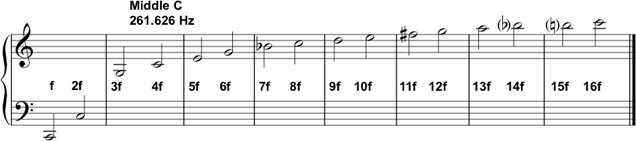
When you press a key on a piano, blow into a wind or brass instrument, pluck a guitar string, or sing you generate a note at a certain frequency. That note is actually composed of several frequencies related by the harmonic series. The frequency of each harmonic is an integer multiple of the fundamental frequency. The fundamental frequency is called the first harmonic. Starting with the fundamental frequency C2 (65.4 Hz), two octaves below middle C, the harmonic series consists of these notes.
The harmonic series starting from a fundamental frequency of 100 Hz would produce these sounds.
| Name | Frequency |
Fundamental 100 Hz |
|
| Fundamental frequency or First harmonic |
f |
100 |
|
| 2nd Harmonic | 2*f |
200 |
|
3rd Harmonic |
3*f |
300 |
|
| 4th Harmonic | 4*f |
400 |
|
| 5th Harmonic | 5*f |
500 |
|
| 6th Harmonic | 6*f |
600 |
|
| 7th Harmonic | 7*f |
700 |
|
| 8th Harmonic | 8*f |
800 |
|
| 9th Harmonic | 9*f |
900 |
|
| 10th Harmonic | 10*f |
1000 |
|
| 11th Harmonic | 11*f |
1100 |
|
| 12th Harmonic | 12*f |
1200 |
|
| 13th Harmonic | 13*f |
1300 |
|
| 14th Harmonic | 14*f |
1400 |
|
| 15th Harmonic | 15*f |
1500 |
|
| 16th Harmonic | 16*f |
1600 |
These terms are often used misused when describing notes in the harmonic series. Harmonics and overtones refer to integer multiples of a fundamental frequency, the notes in the harmonic series. The fundamental frequency is the first harmonic. The first overtone is the second harmonic. A partial is a non integer multiple of the the fundamental frequency and does not occur in the harmonic series.
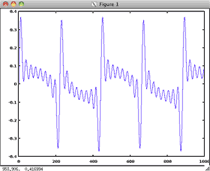
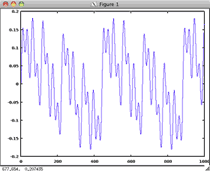
Additive synthesis mixes different frequencies in various combinations and strengths. Listen to how the timbre changes when different harmonics from the harmonic series are added together. The fundamental frequency is 100 Hz.
Name |
Harmonics |
Waveform |
Sound |
| Fundamental frequency or First harmonic |
f |
 |
|
| All harmonics | 1-16 |
 |
|
| Odd harmonics | 1 3 5 7 9 11 13 15 |
 |
|
Even harmonics |
1 2 4 6 8 10 12 14 16 |
 |
|
| Octaves | 1 2 4 8 16 |
 |
|
| Three Five Seven | 3 5 7 |
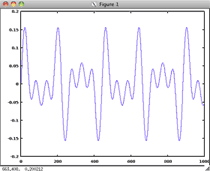 |
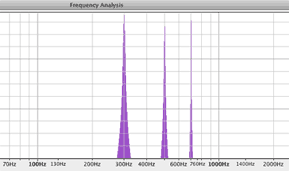
Compare harmonic number 1, harmonic number 3, and the "Three Five Seven" synthesized sound. The third, fifth, and seventh harmonics by themselves seem to recreate the missing fundamental frequency.
| Fundamental frequency or First harmonic |
f |
|
3rd Harmonic |
3*f |
|
| Only Three Five Seven only | 3 5 7 |
An 18th century mathematician named Jean Baptiste Fourier is known for a famous theorem called the Fourier Transform. This theorem states that any periodic waveform can be broken down into the sum of a series of sine waves with varied amplitudes and phases, all related by integer multiples to a fundamental frequency. The Fourier transform breaks up a waveform into its constituent frequencies and has been called the most important theorem in the field of digital signal processing. The Fast Fourier Transform (FFT) is a computer algorithm that performs the Fourier Transform very quickly. It wasn't until the 1990's that desktop computers could calculate the FFT in real time.
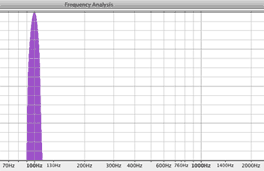
The FFT and the Inverse FFT let you examine a waveform in either the time domain or the frequency domain. No information is lost in the conversion. In the time domain the sound wave is plotted against time on the x axis and amplitude on the y axis. In the frequency domain, the spectrum of the sound wave is plotted as frequencies on the x axis and amplitude on the y axis. You'll learn more about the FFT and Frequency domain in Unit 8. These Spectrum plots were created with the free open source sound editor Audacity.
Harmonics |
Waveform in the Time Domain |
Spectrum in the Frequency Domain |
1 Fundamental Frequency |
|
 |
1-16 |
|
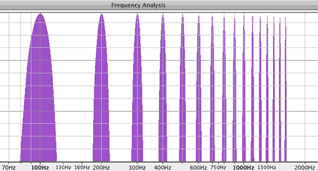 |
1 3 5 7 9 11 13 15 |
|
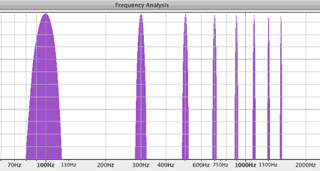 |
| 1 2 4 6 8 10 12 14 16 |
|
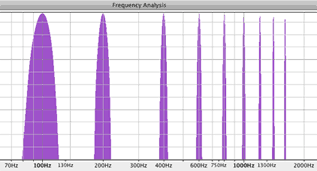 |
1 2 4 8 16 |
|
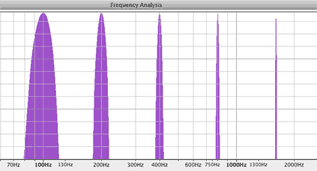 |
3 5 7 |
|
 |